Journey reports
Measure how many people enter, move through, and finish a journey, and see who reached your goal.
Written By Bruno
Last updated 10 minutes ago
Overview
A journey report shows how people move through a live journey: how many entered, where they are now, how they left, and how many reached your goal. The quickest way to read it is on the canvas. Switch the editor to Report and click a block card to see its numbers and the people behind them. The full report shows the whole journey on one page.
Reports are available after you publish a journey for the first time. Before that, the editor has no Report tab, and Full report in the More actions menu shows Publish first to see the report.
See numbers on the canvas
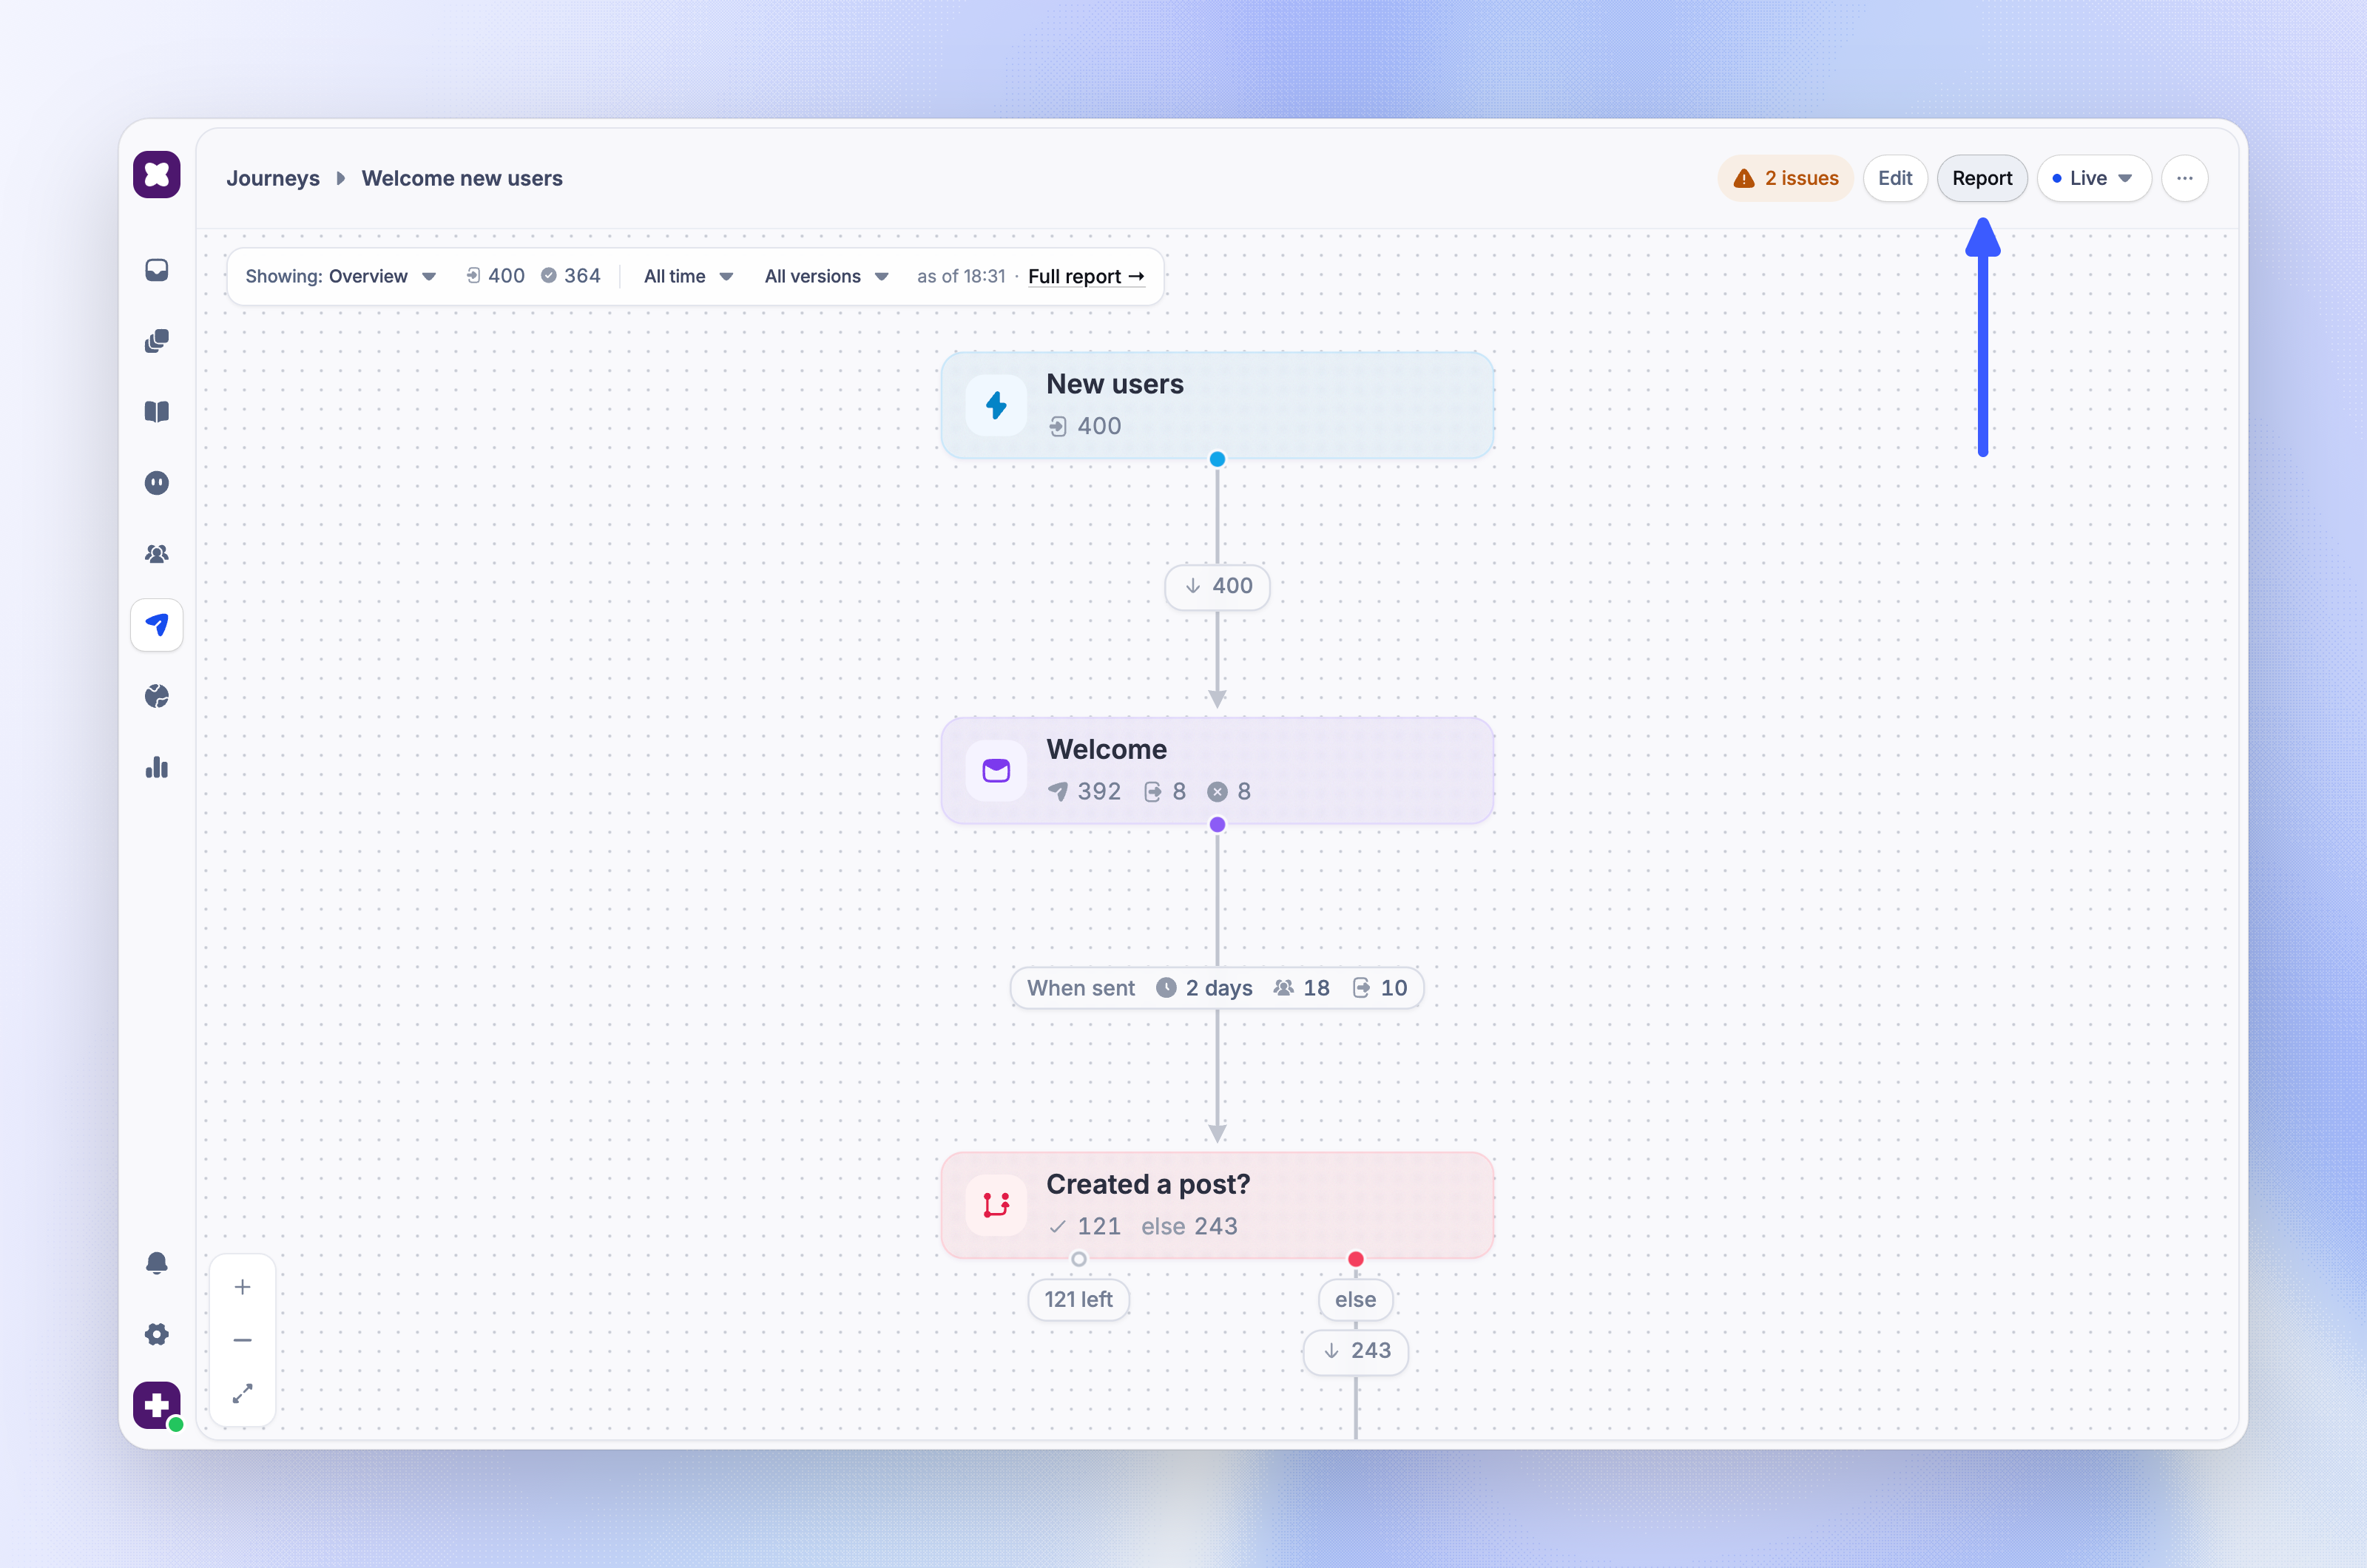
Go to Dashboard → Outbound → Journeys and click a live journey
Click Report in the editor header
Clicking the name of a live journey in the list opens this view directly. Each block card shows its counts, such as how many people entered, were sent a message, or matched a rule. The label on each path shows how many people took it.
The toolbar at the top of the canvas shows the range and version, for example All time and All versions. Click 'Full report →' to open the full report.
Open a block's stats
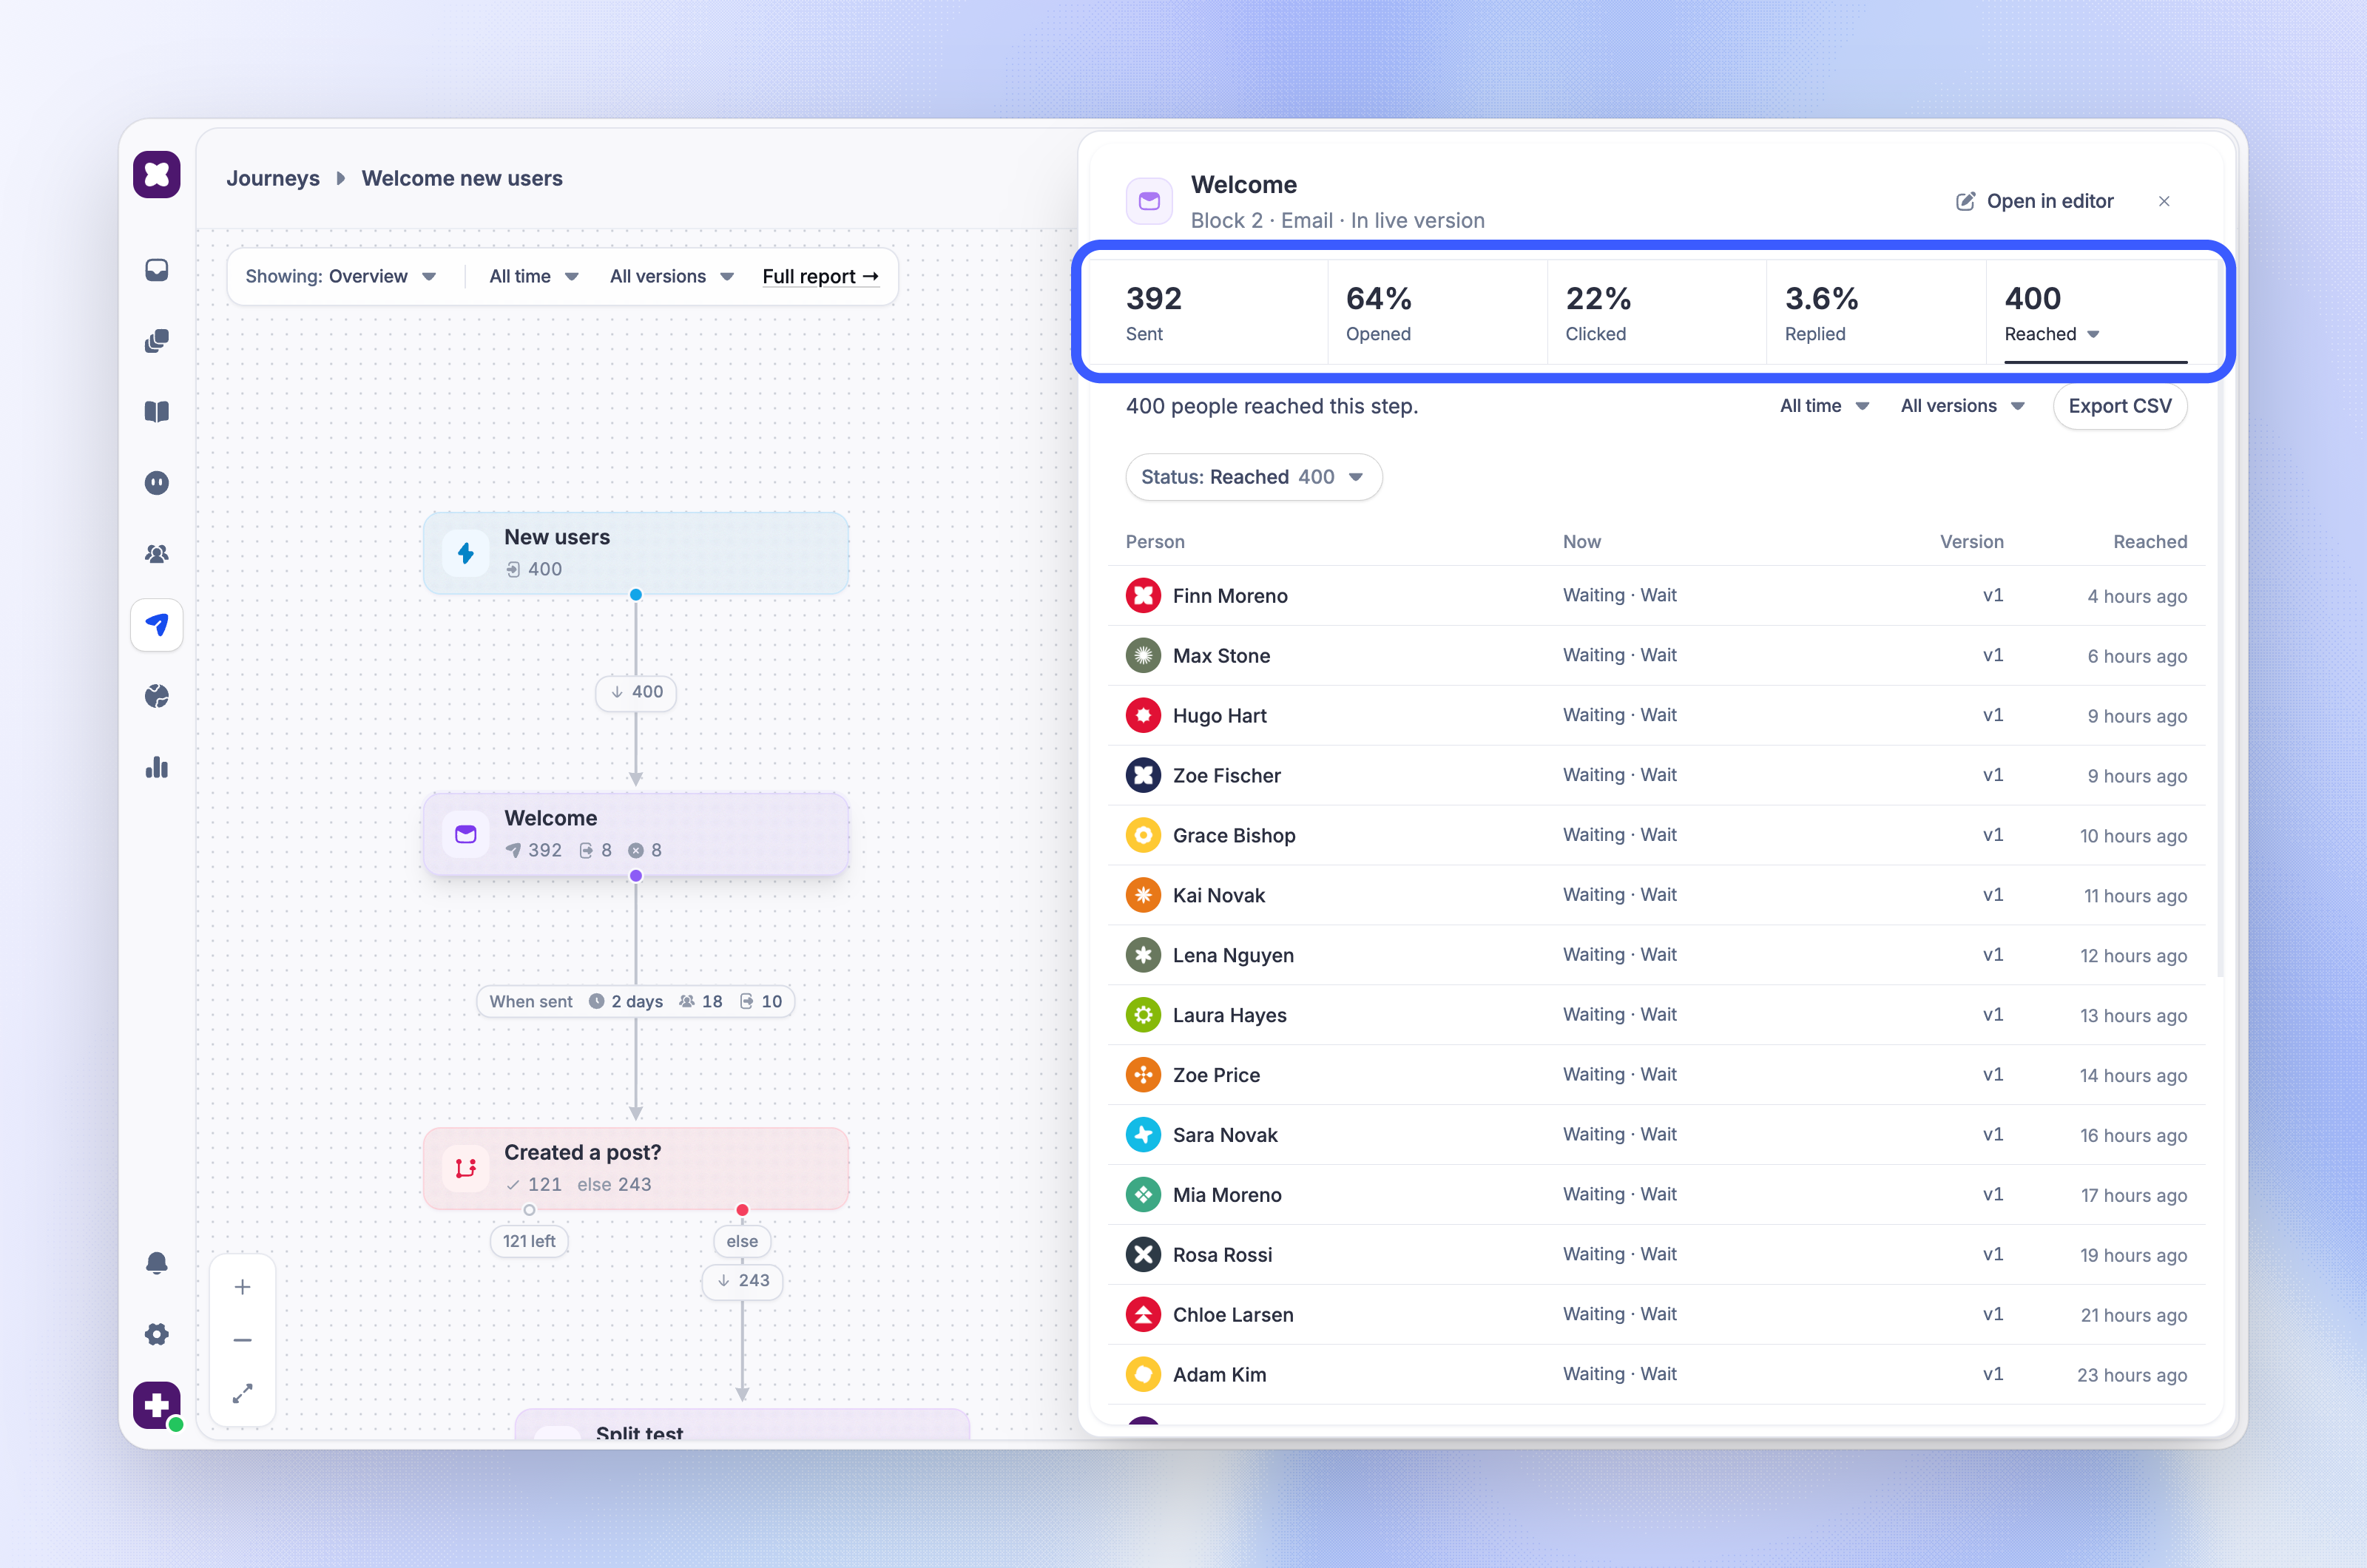
Click a block card to open its stats sheet. The tiles at the top show the block's numbers. Click a tile to list the people behind it, with the block they are on Now, their Version, and when they Reached the block. Tiles that do not fit are in the last tile's menu, for example Reached and Not sent.
Every block shows how many people Reached it. The other tiles depend on the block type:
Each sheet has its own All time and All versions pickers. Click 'Export CSV' to download the list you see, or 'Open in editor' to change the block. A Split test block shows its results in the sheet; see Split testing in journeys.
See who clicked a link
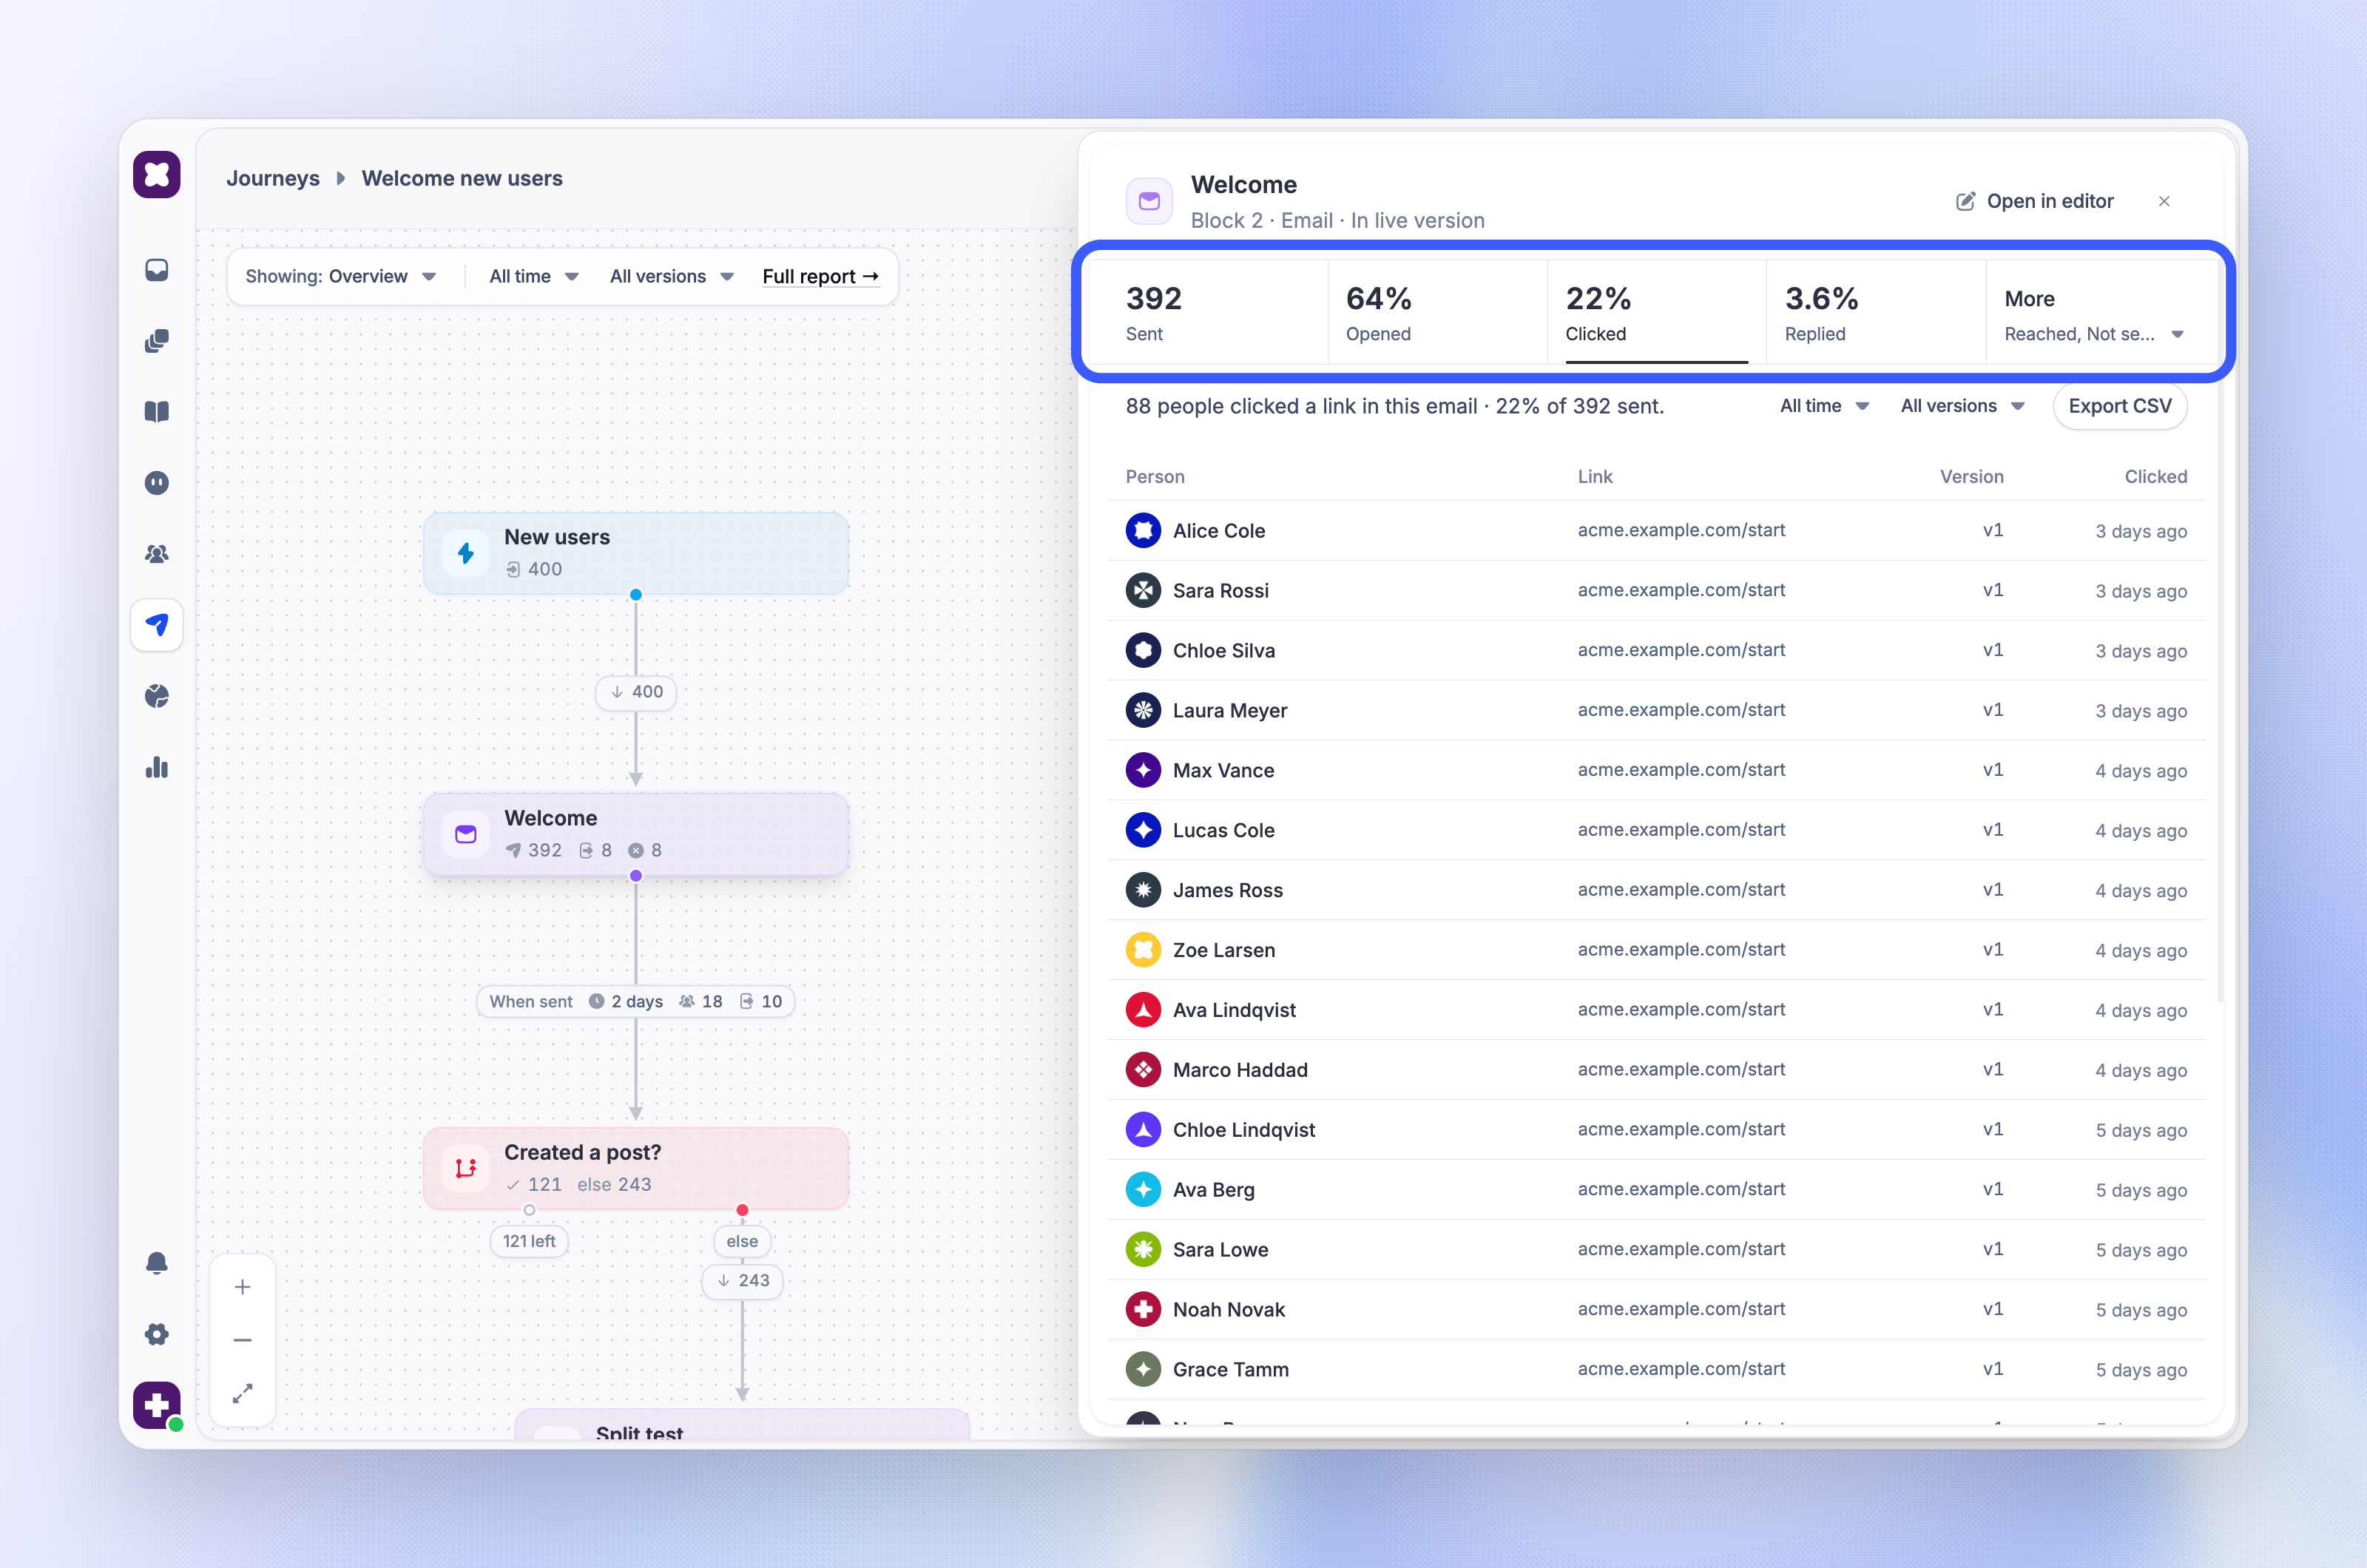
Click Clicked on an email block to see who clicked a link. The line above the list gives the total, for example 88 people clicked a link in this email · 22% of 392 sent. Each row shows the Link the person clicked and when they Clicked.
See who matched a rule
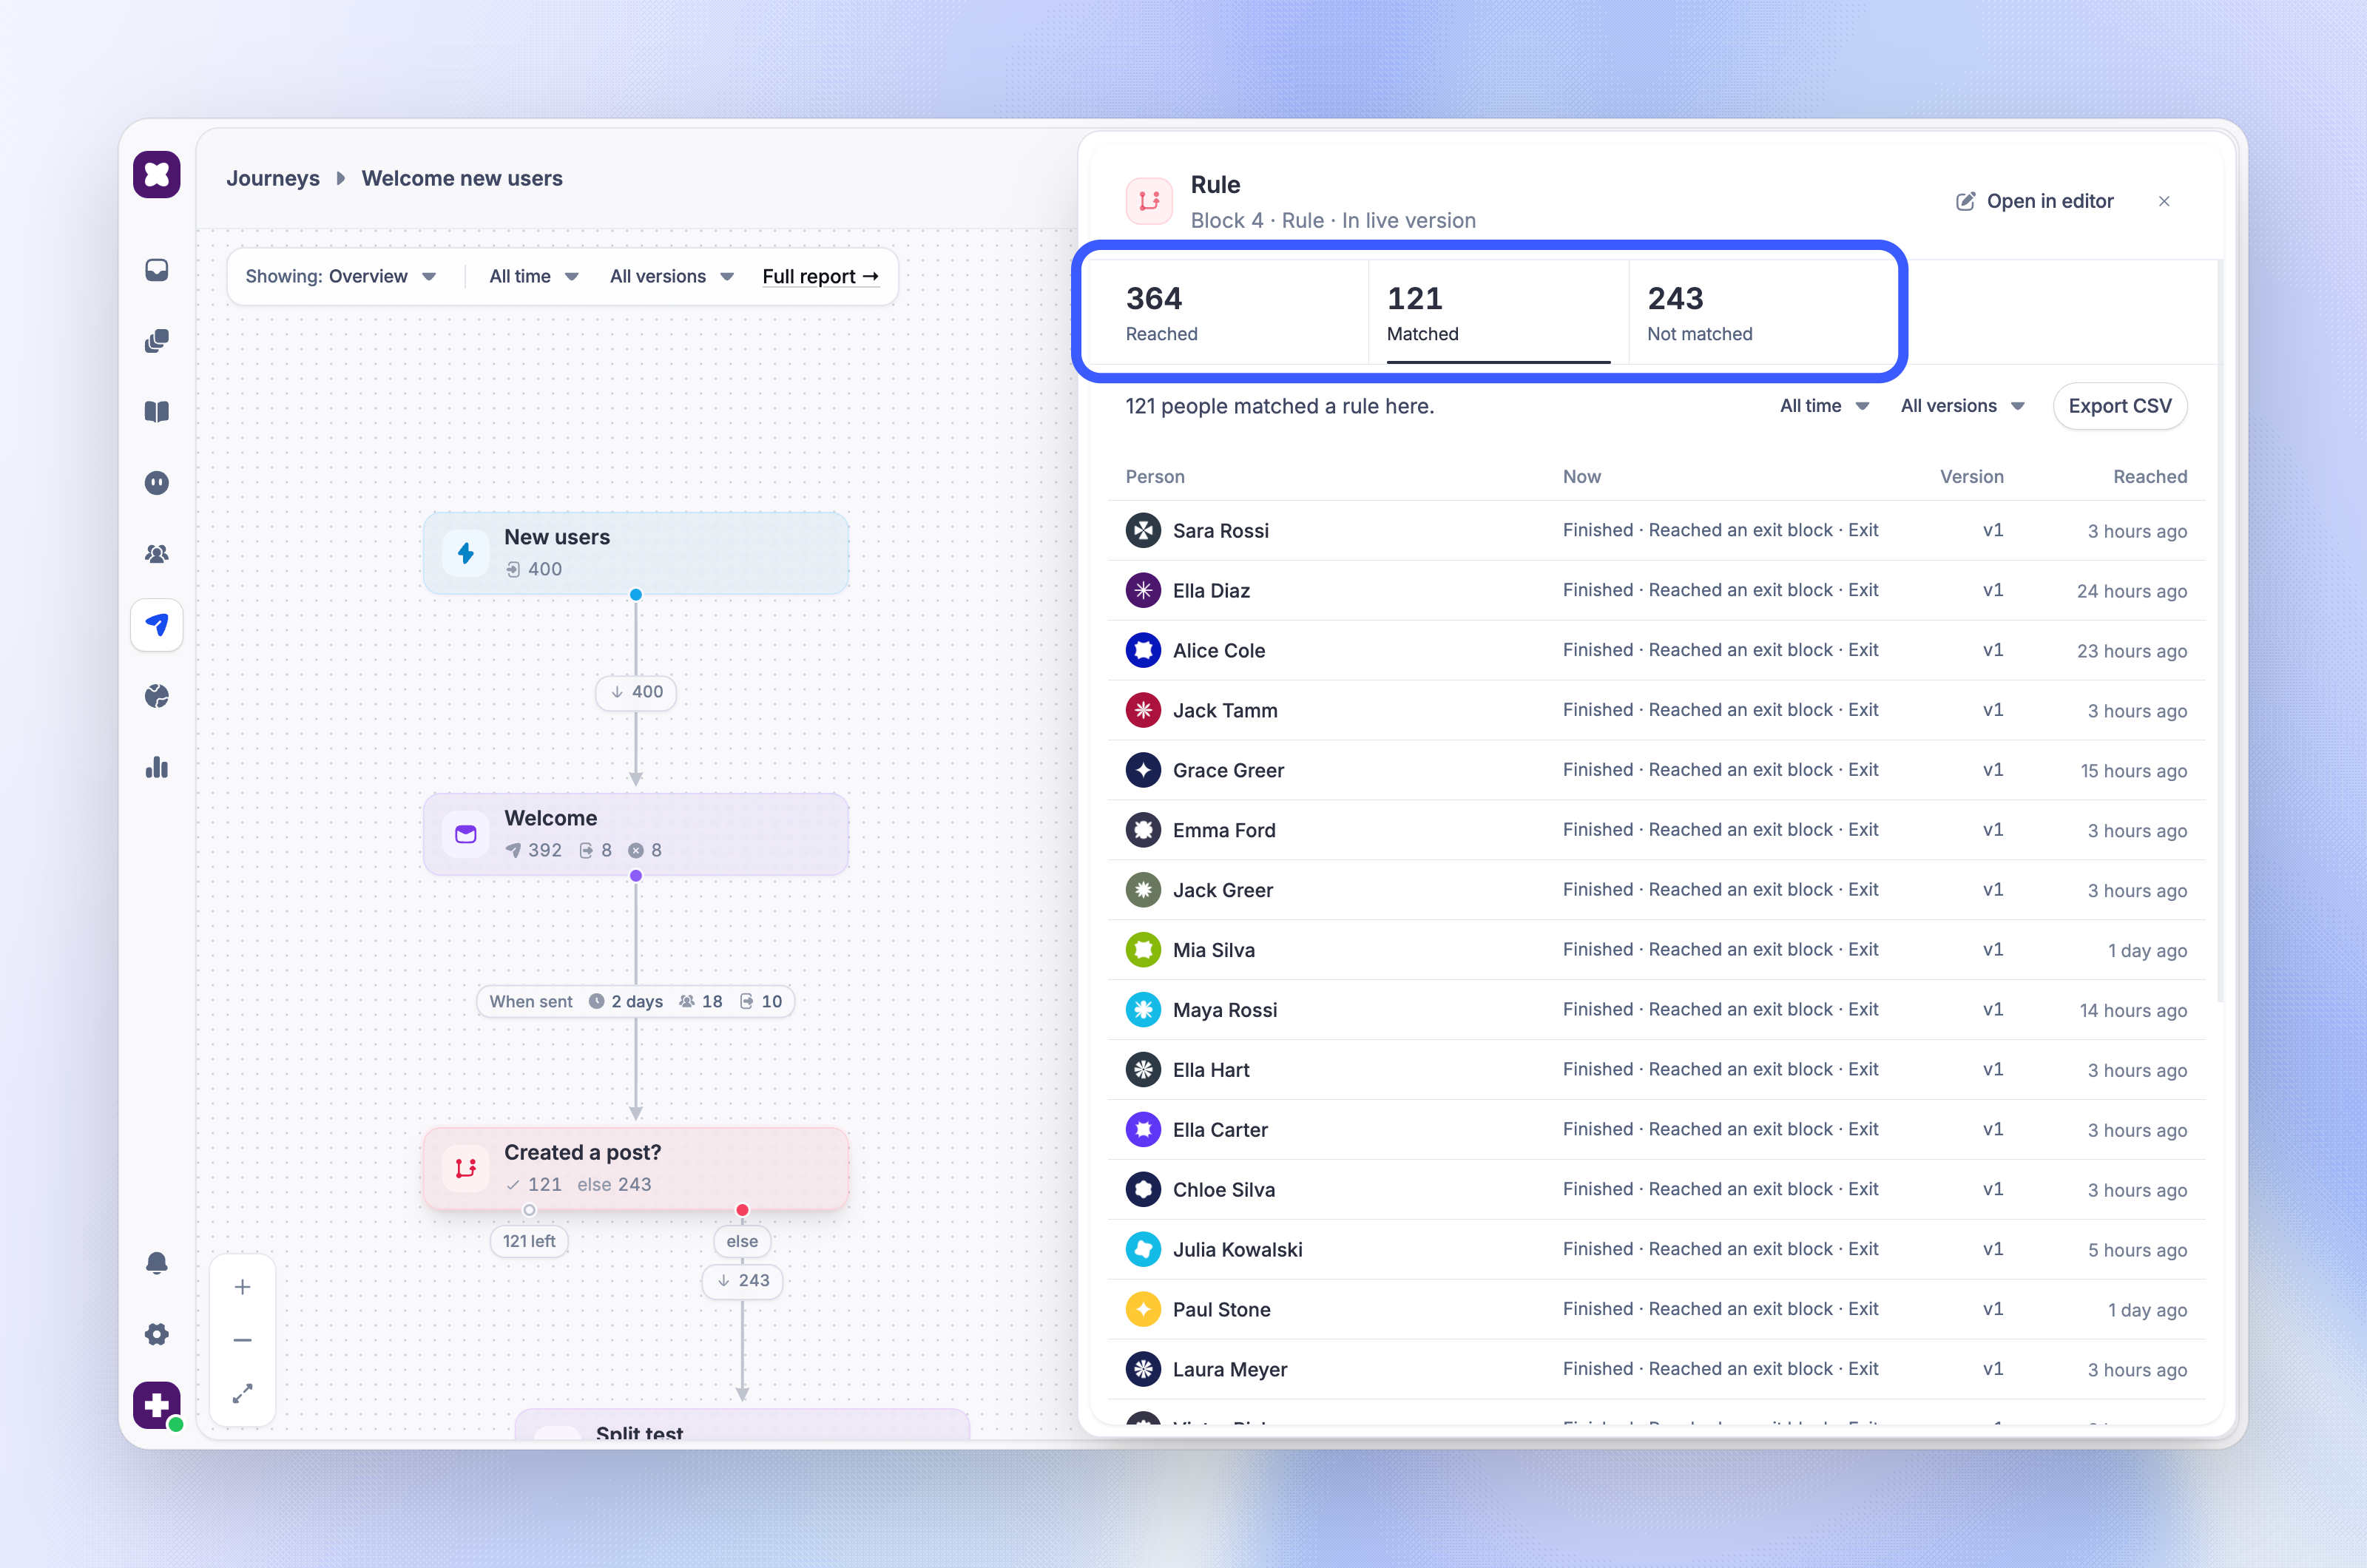
A Rule block shows how many people Reached it, how many Matched a branch, and how many were Not matched and took the Else path. Click Matched or Not matched to see these people and where they are now.
See a person's journey path
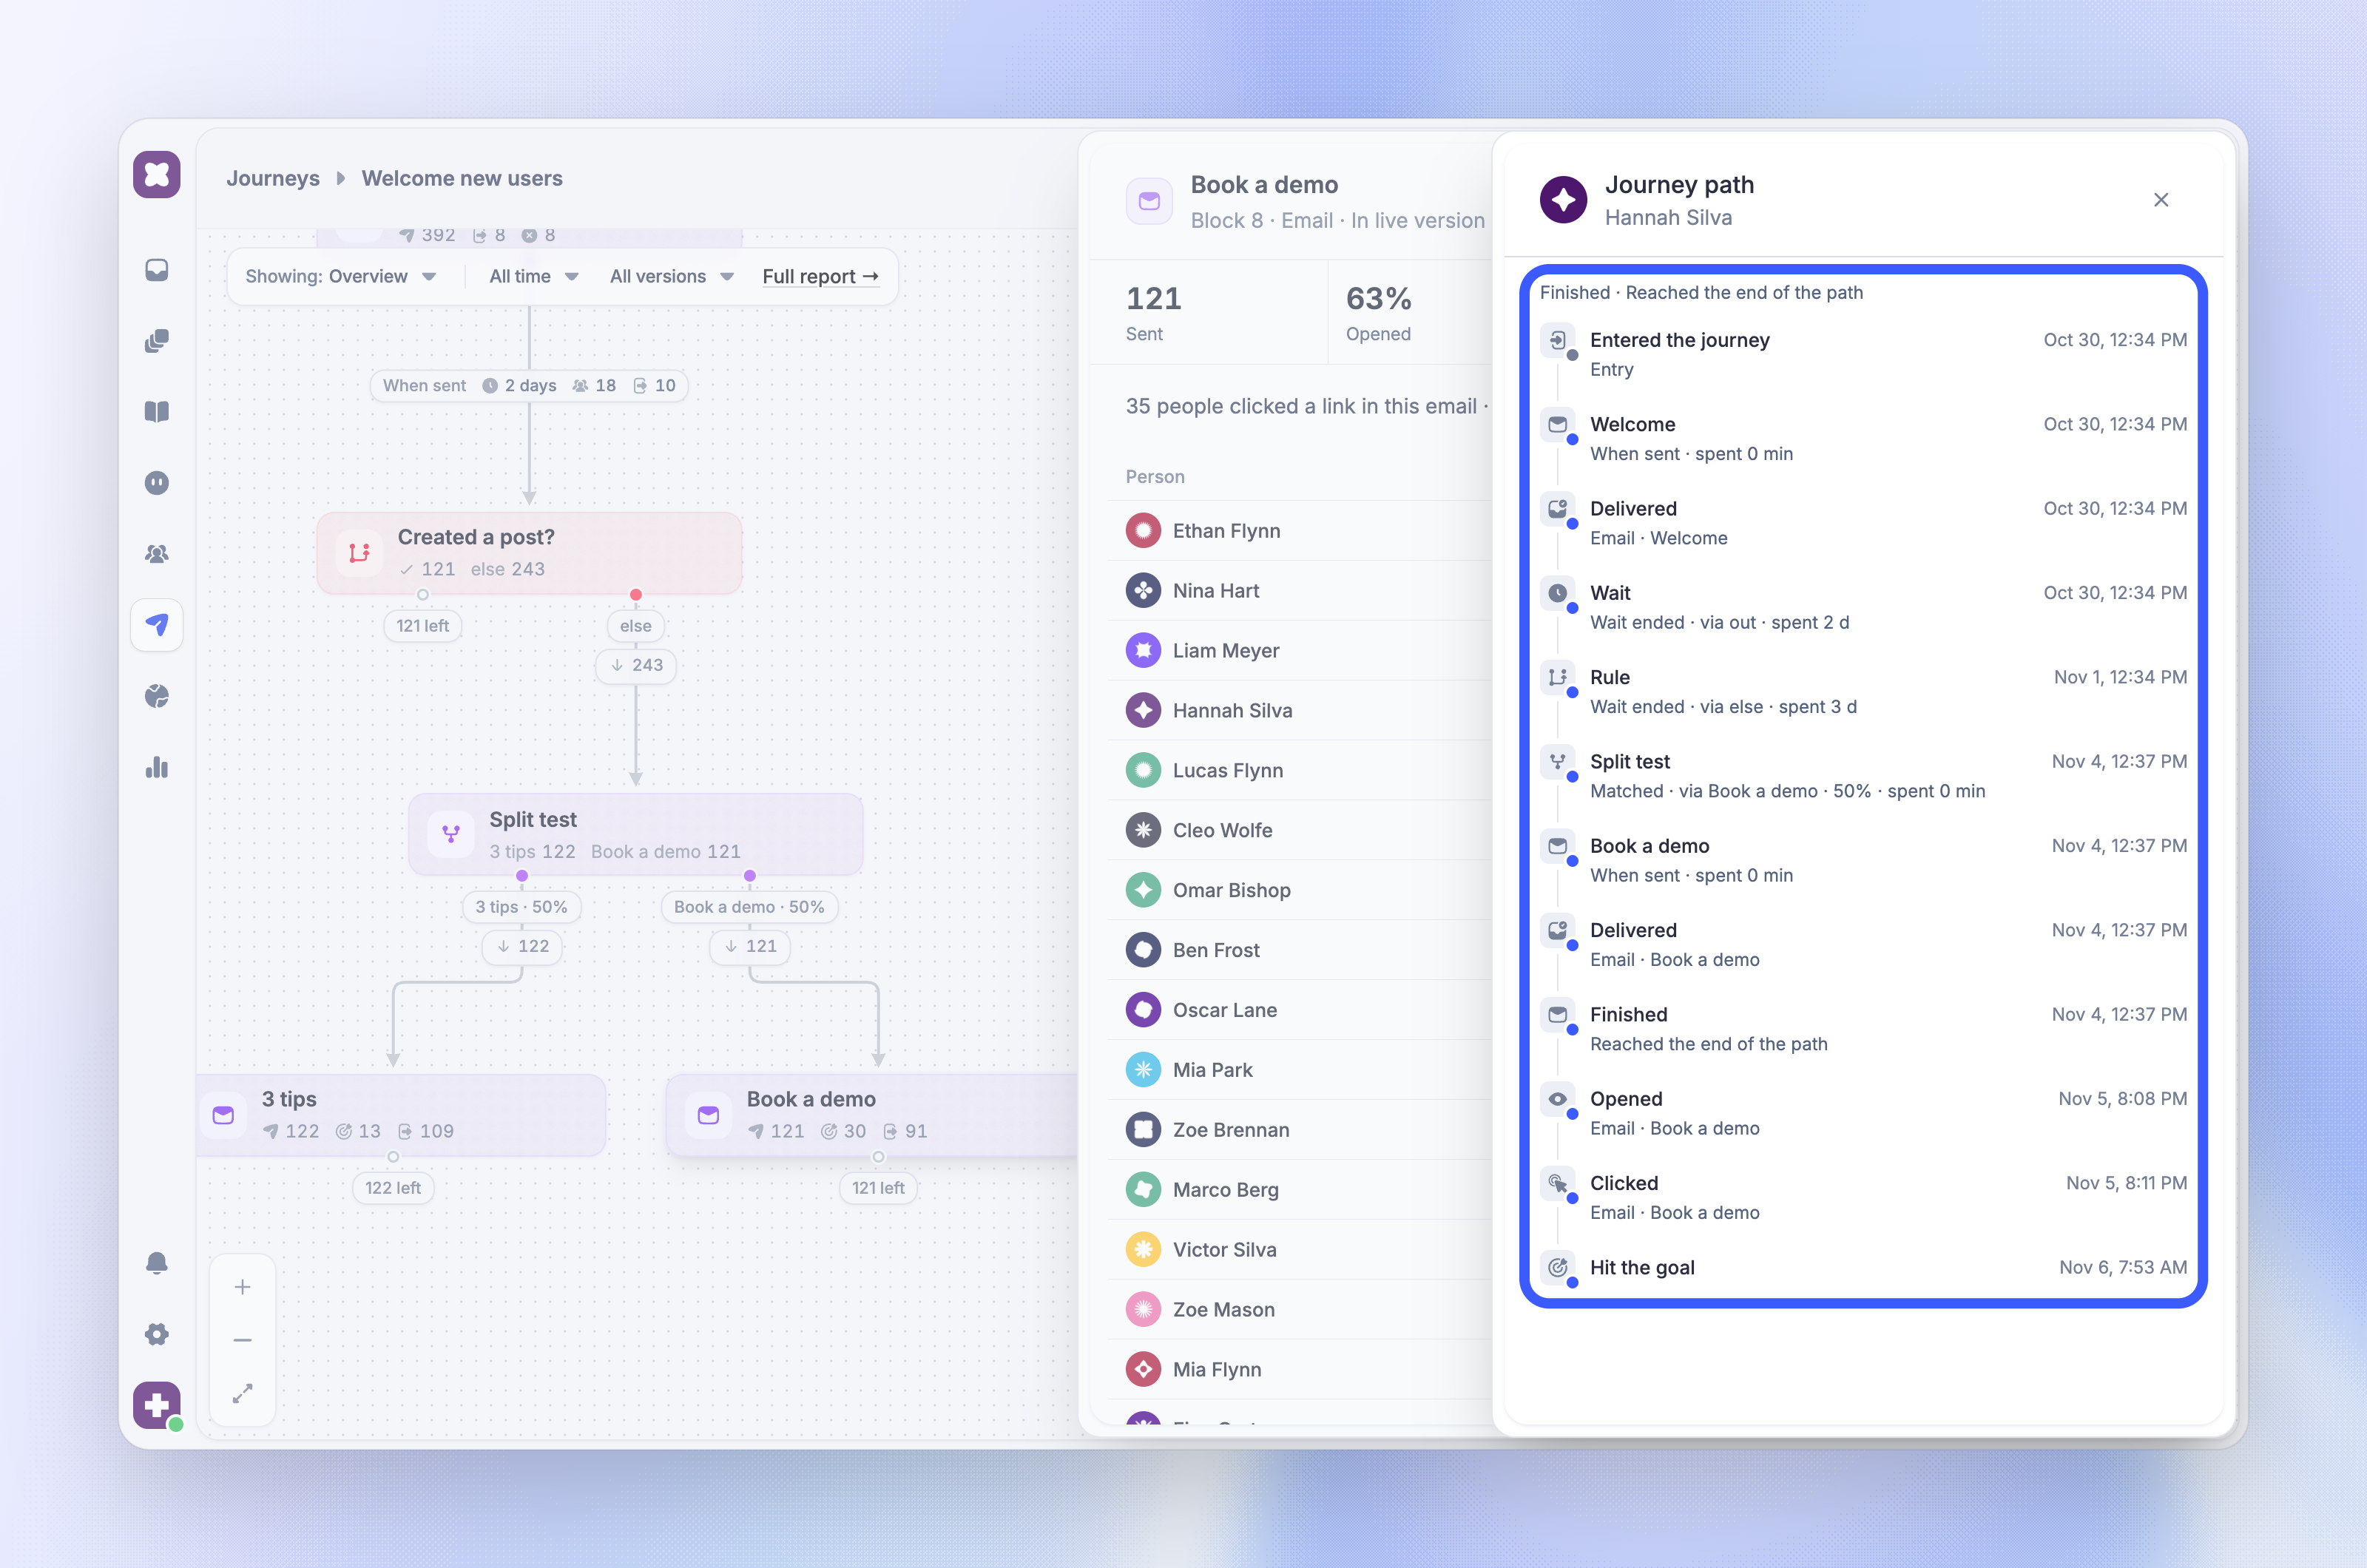
Click a person in a block's list to open their Journey path. It shows each step with its time: when they entered, each block they reached and the path they took, each delivery, open, and click, and when they hit the goal. The line at the top shows where the person is now and why they left, for example Finished · Reached the end of the path.
You need the View Users permission to see people in a report.
Choose the range and version
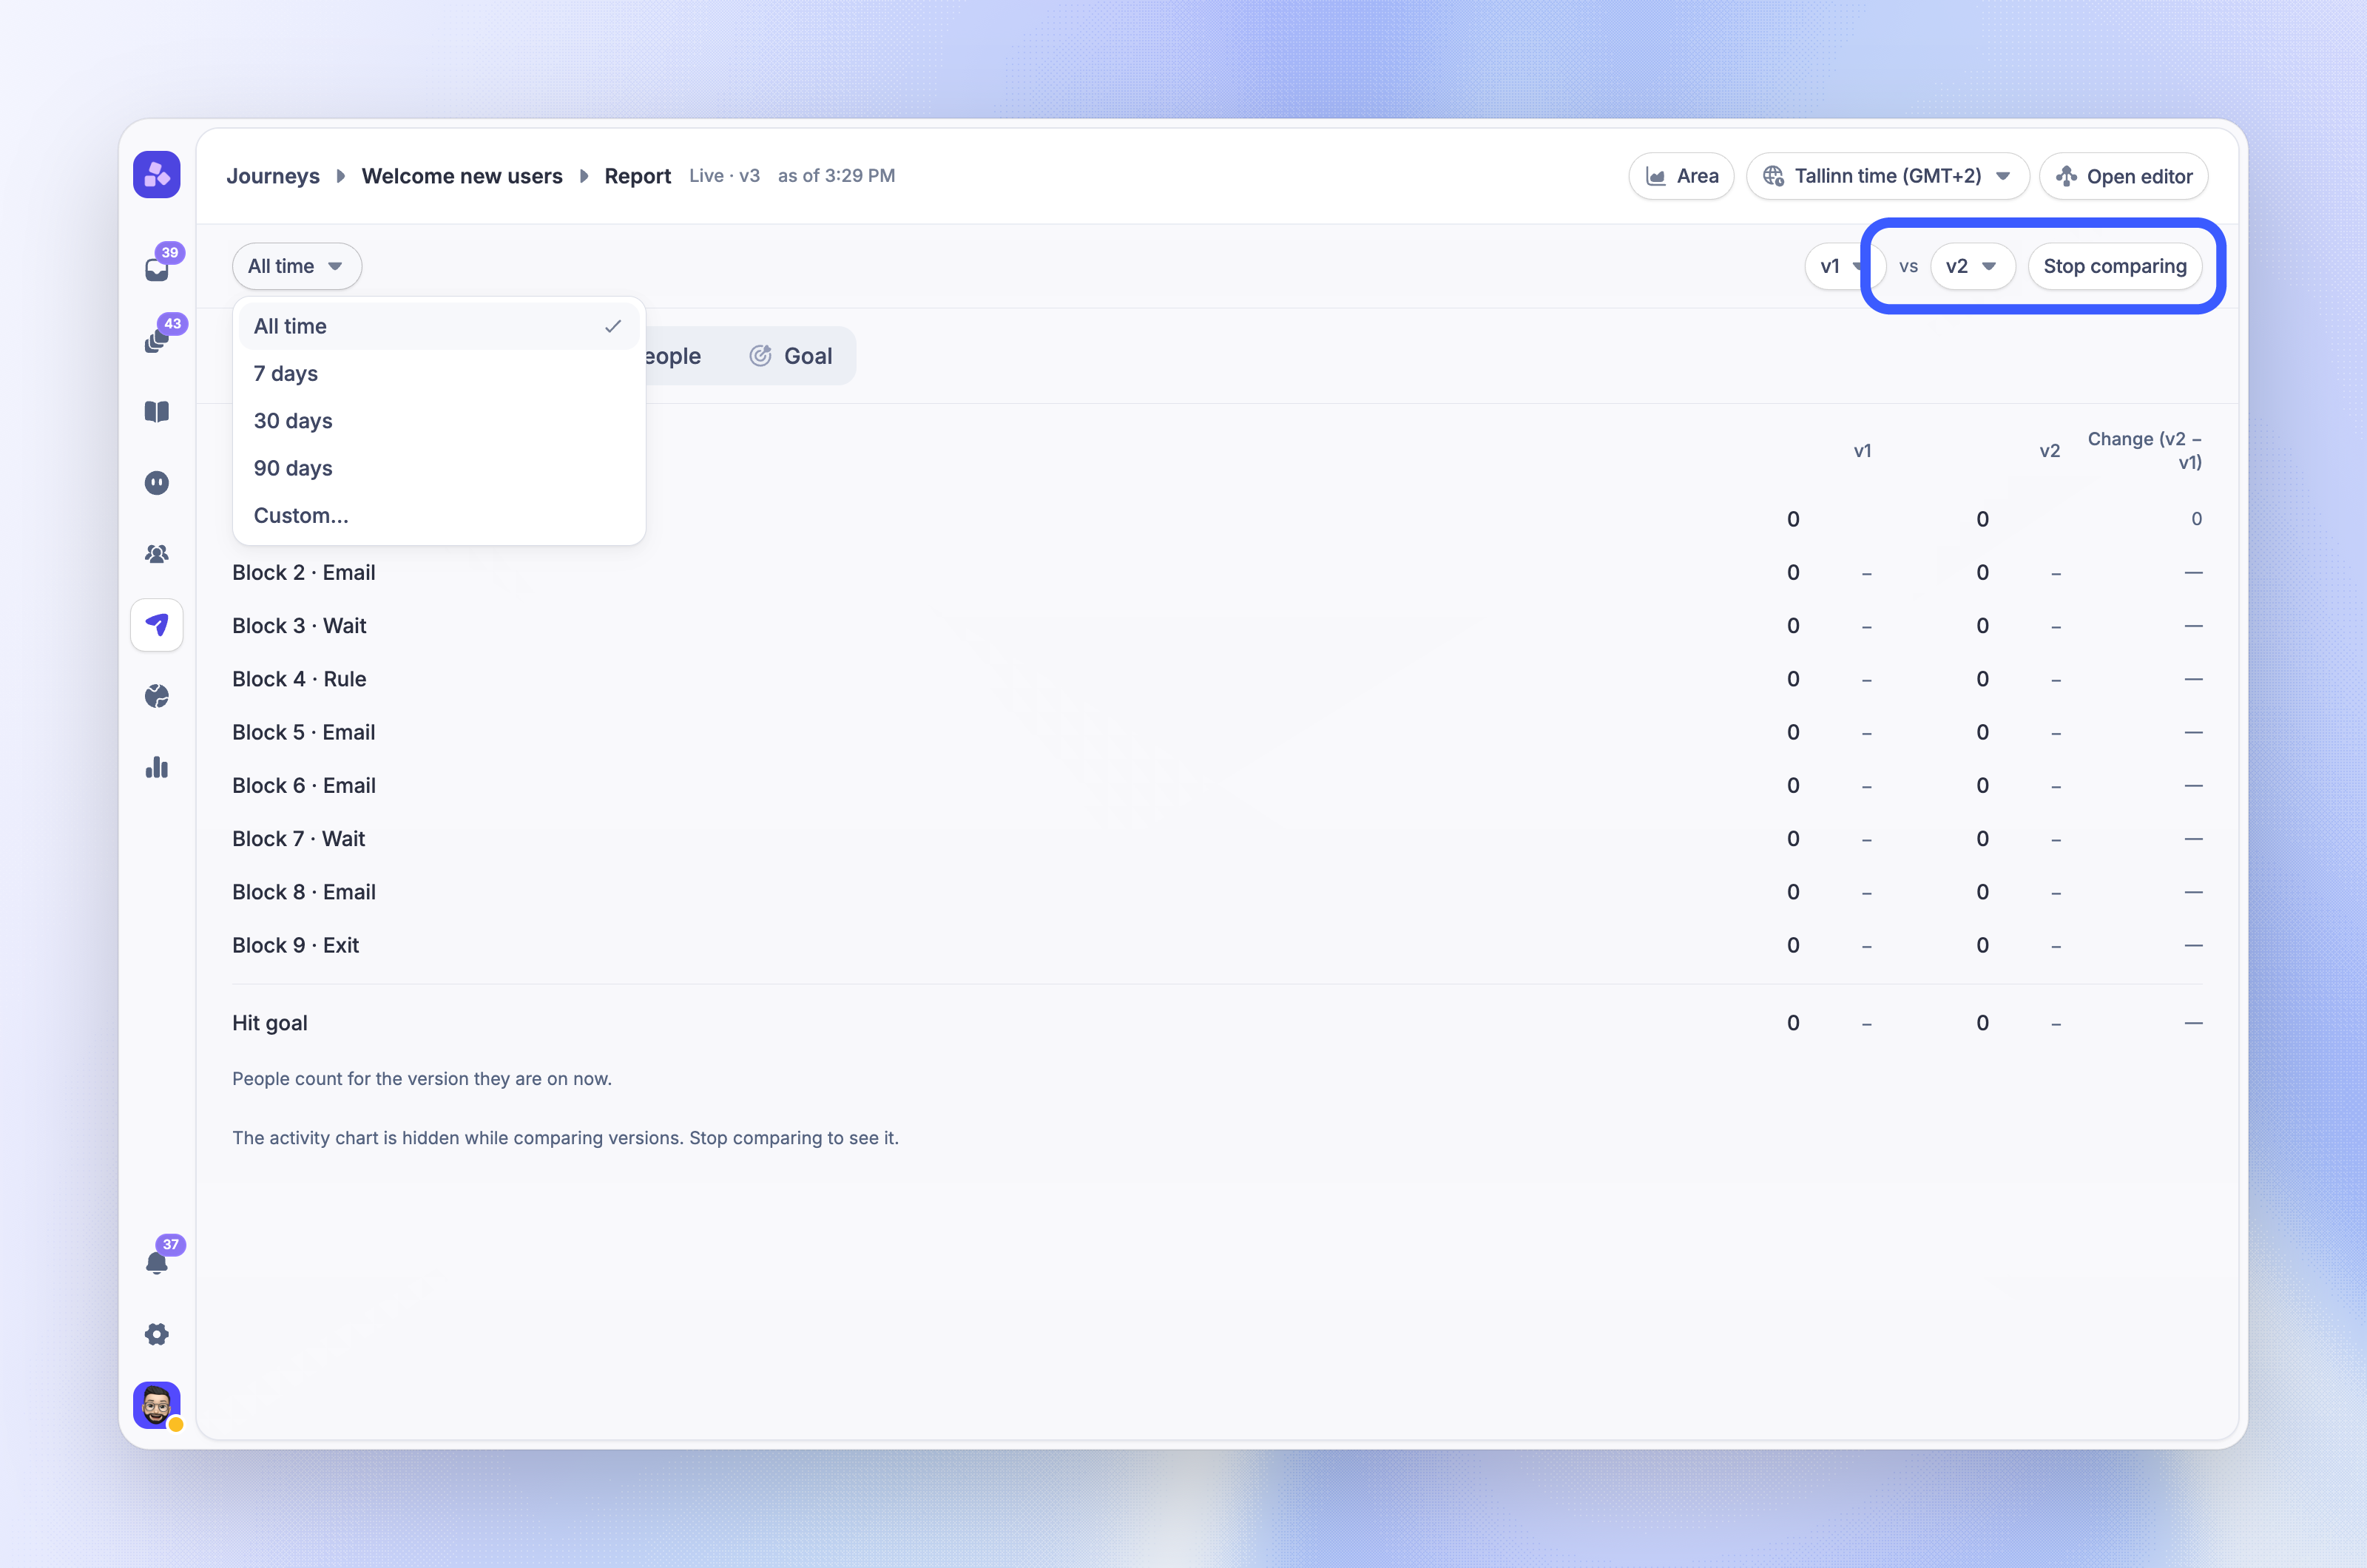
The range and version pickers control which people the numbers include. Every view uses the same scope, except split test results.
Range - All time (default), 7, 30, or 90 days, or Custom. The range selects people by the date they entered the journey, not by the date of a message or a click
Version - All versions or one published version, such as v3
Compare… - In the full report, pick two versions to see their numbers side by side. Click 'Stop comparing' to return to one version
When you compare versions, people count for the version they are on now. If you moved people to a new version when you published, they count for that version. The activity chart is hidden while you compare.
Full report
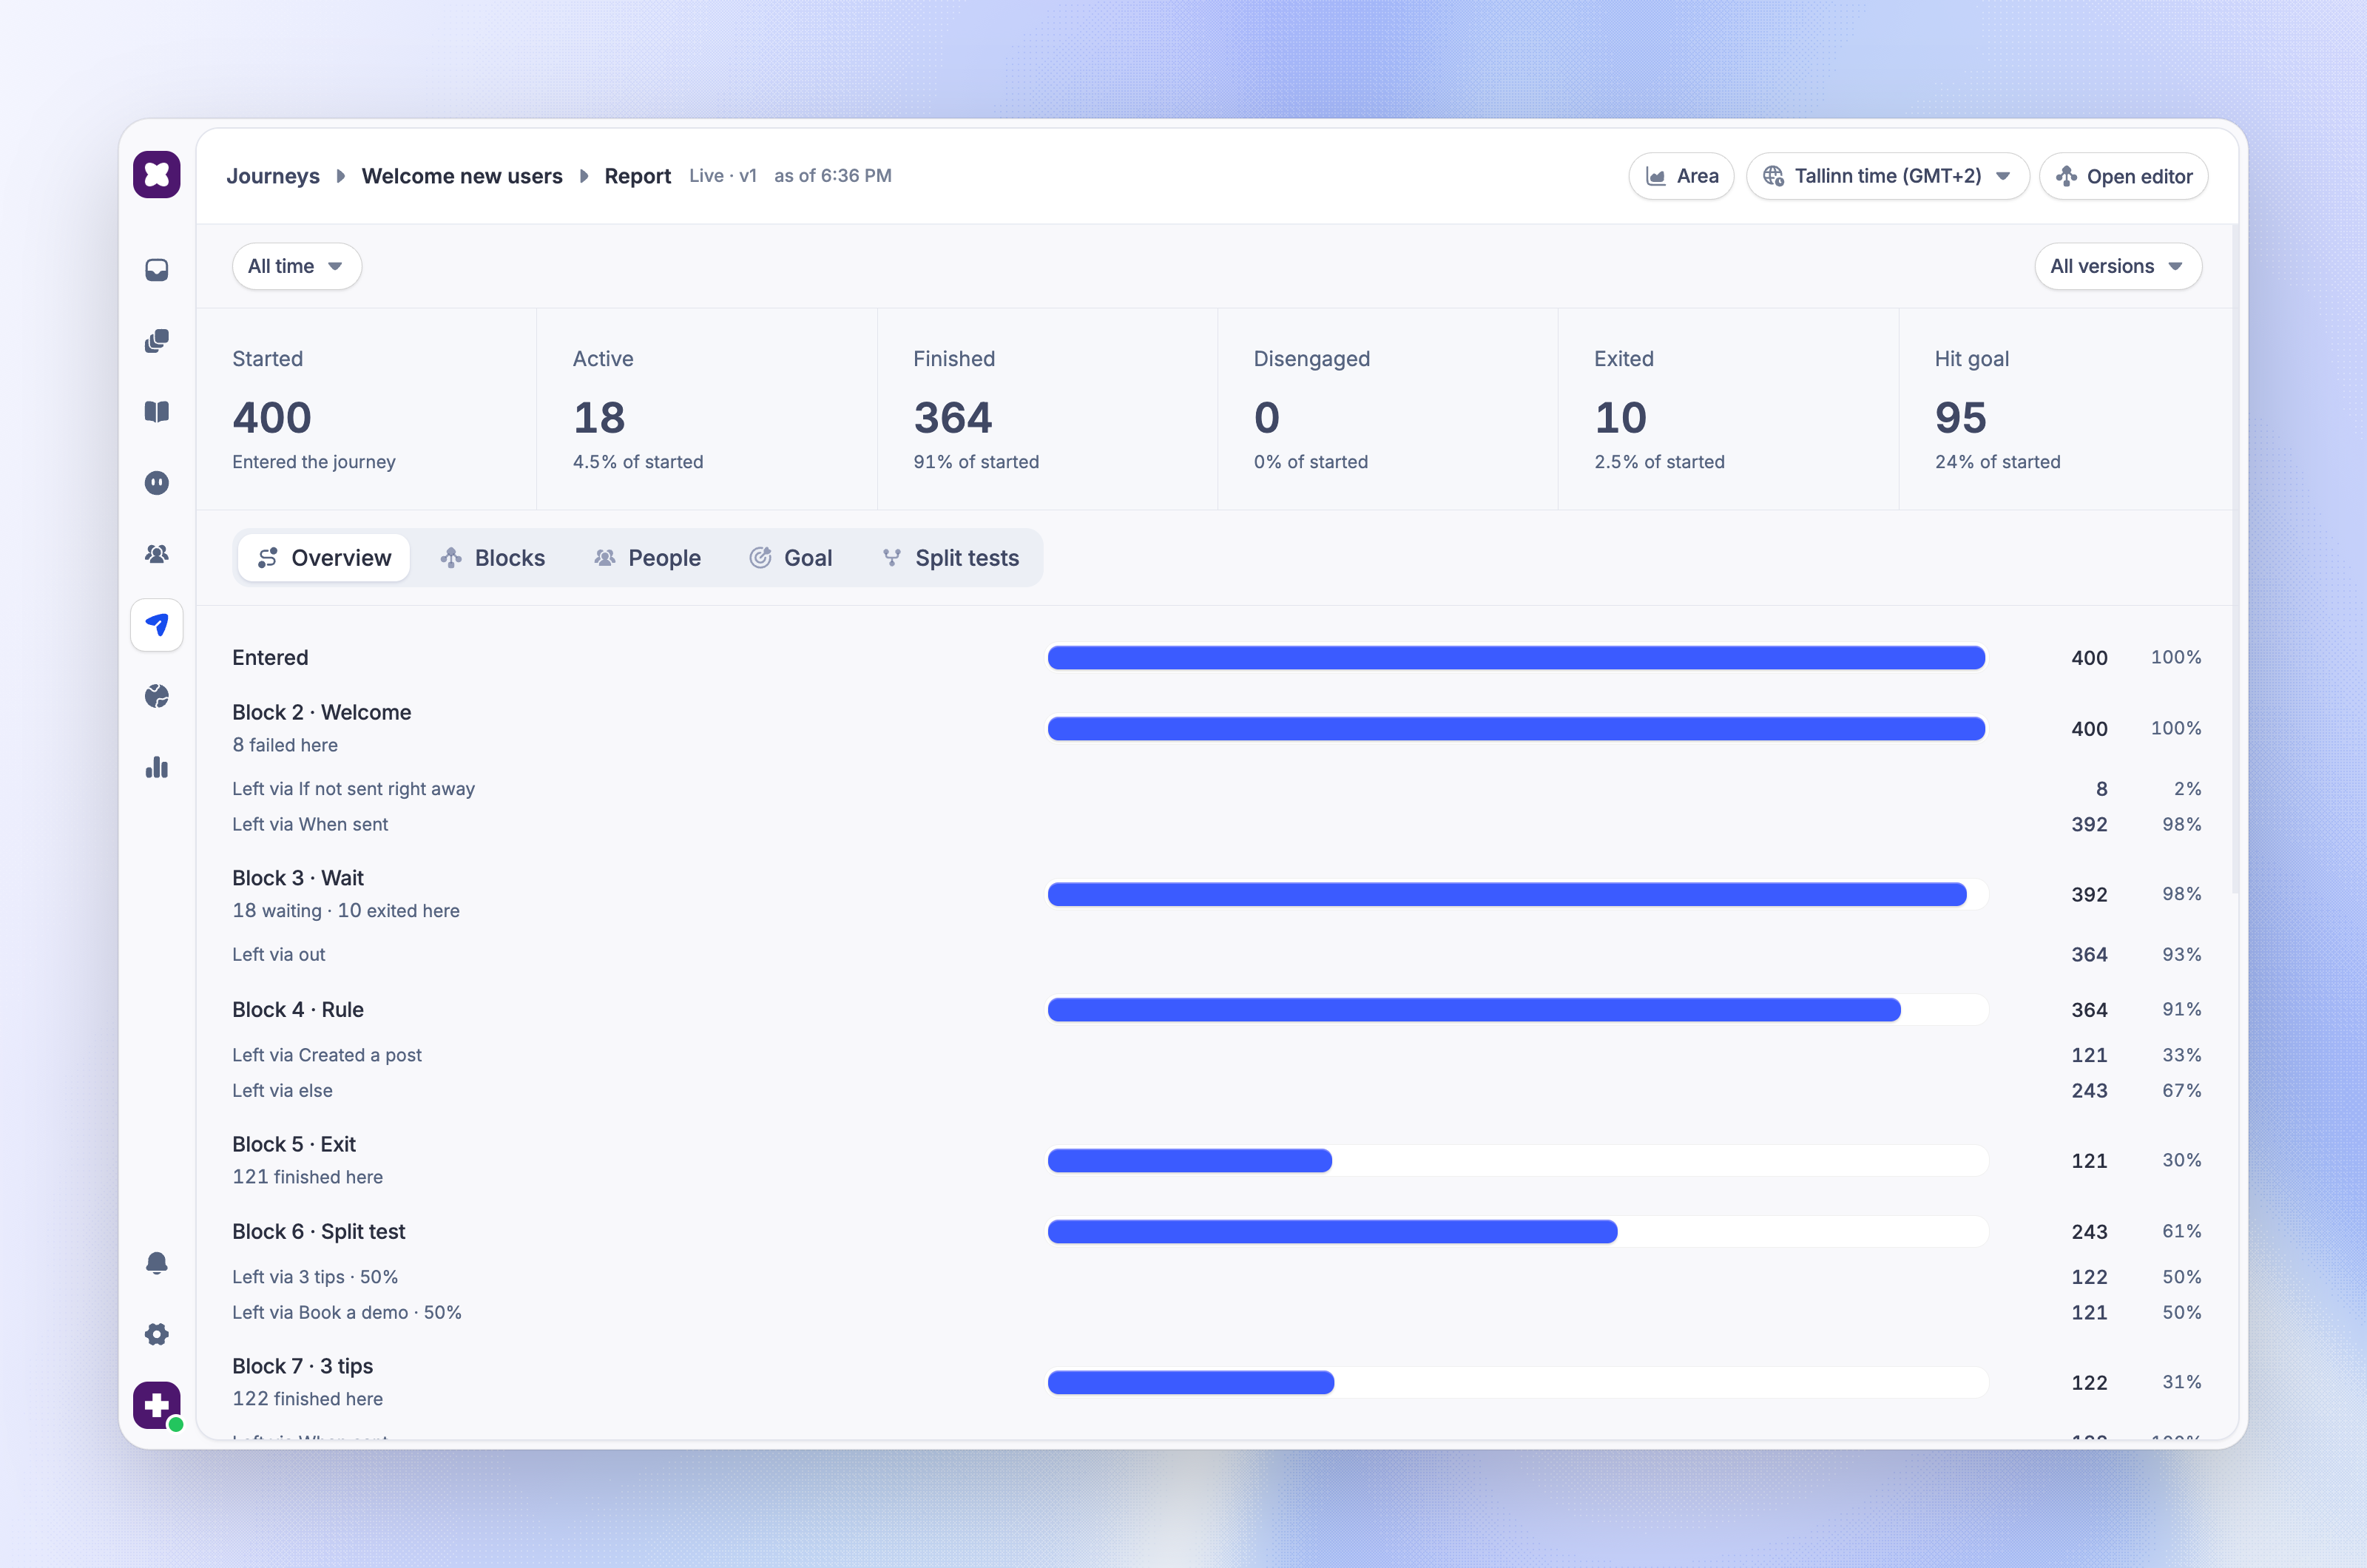
The full report shows the whole journey on one page. To open it, choose one of these options:
Canvas - Click 'Full report →' in the toolbar of the canvas in Report mode
Editor - Open the More actions menu (⋯) in the editor header and choose Full report
List - Open the ⋯ menu on the journey's row and choose Report
Click 'Open editor' to go back to the canvas with the same range and version.
Overview tab
The six tiles at the top summarize everyone in the selected scope. Each rate is a percentage of started.
Hit goal overlaps the other tiles. A person who reached the goal also counts in one of the other tiles, so do not add it to them.
The activity chart shows Entered, Finished, Exited, Disengaged, and Hit goal over time.
The funnel lists every block in path order with the number of people who reached it and the share of everyone who entered. Under each block, you can see how many people left through each of its paths and how many ended there. A block that a later version removed keeps its counts and shows Removed in current version.
Click any count to open the matching people in the People tab.
Blocks tab
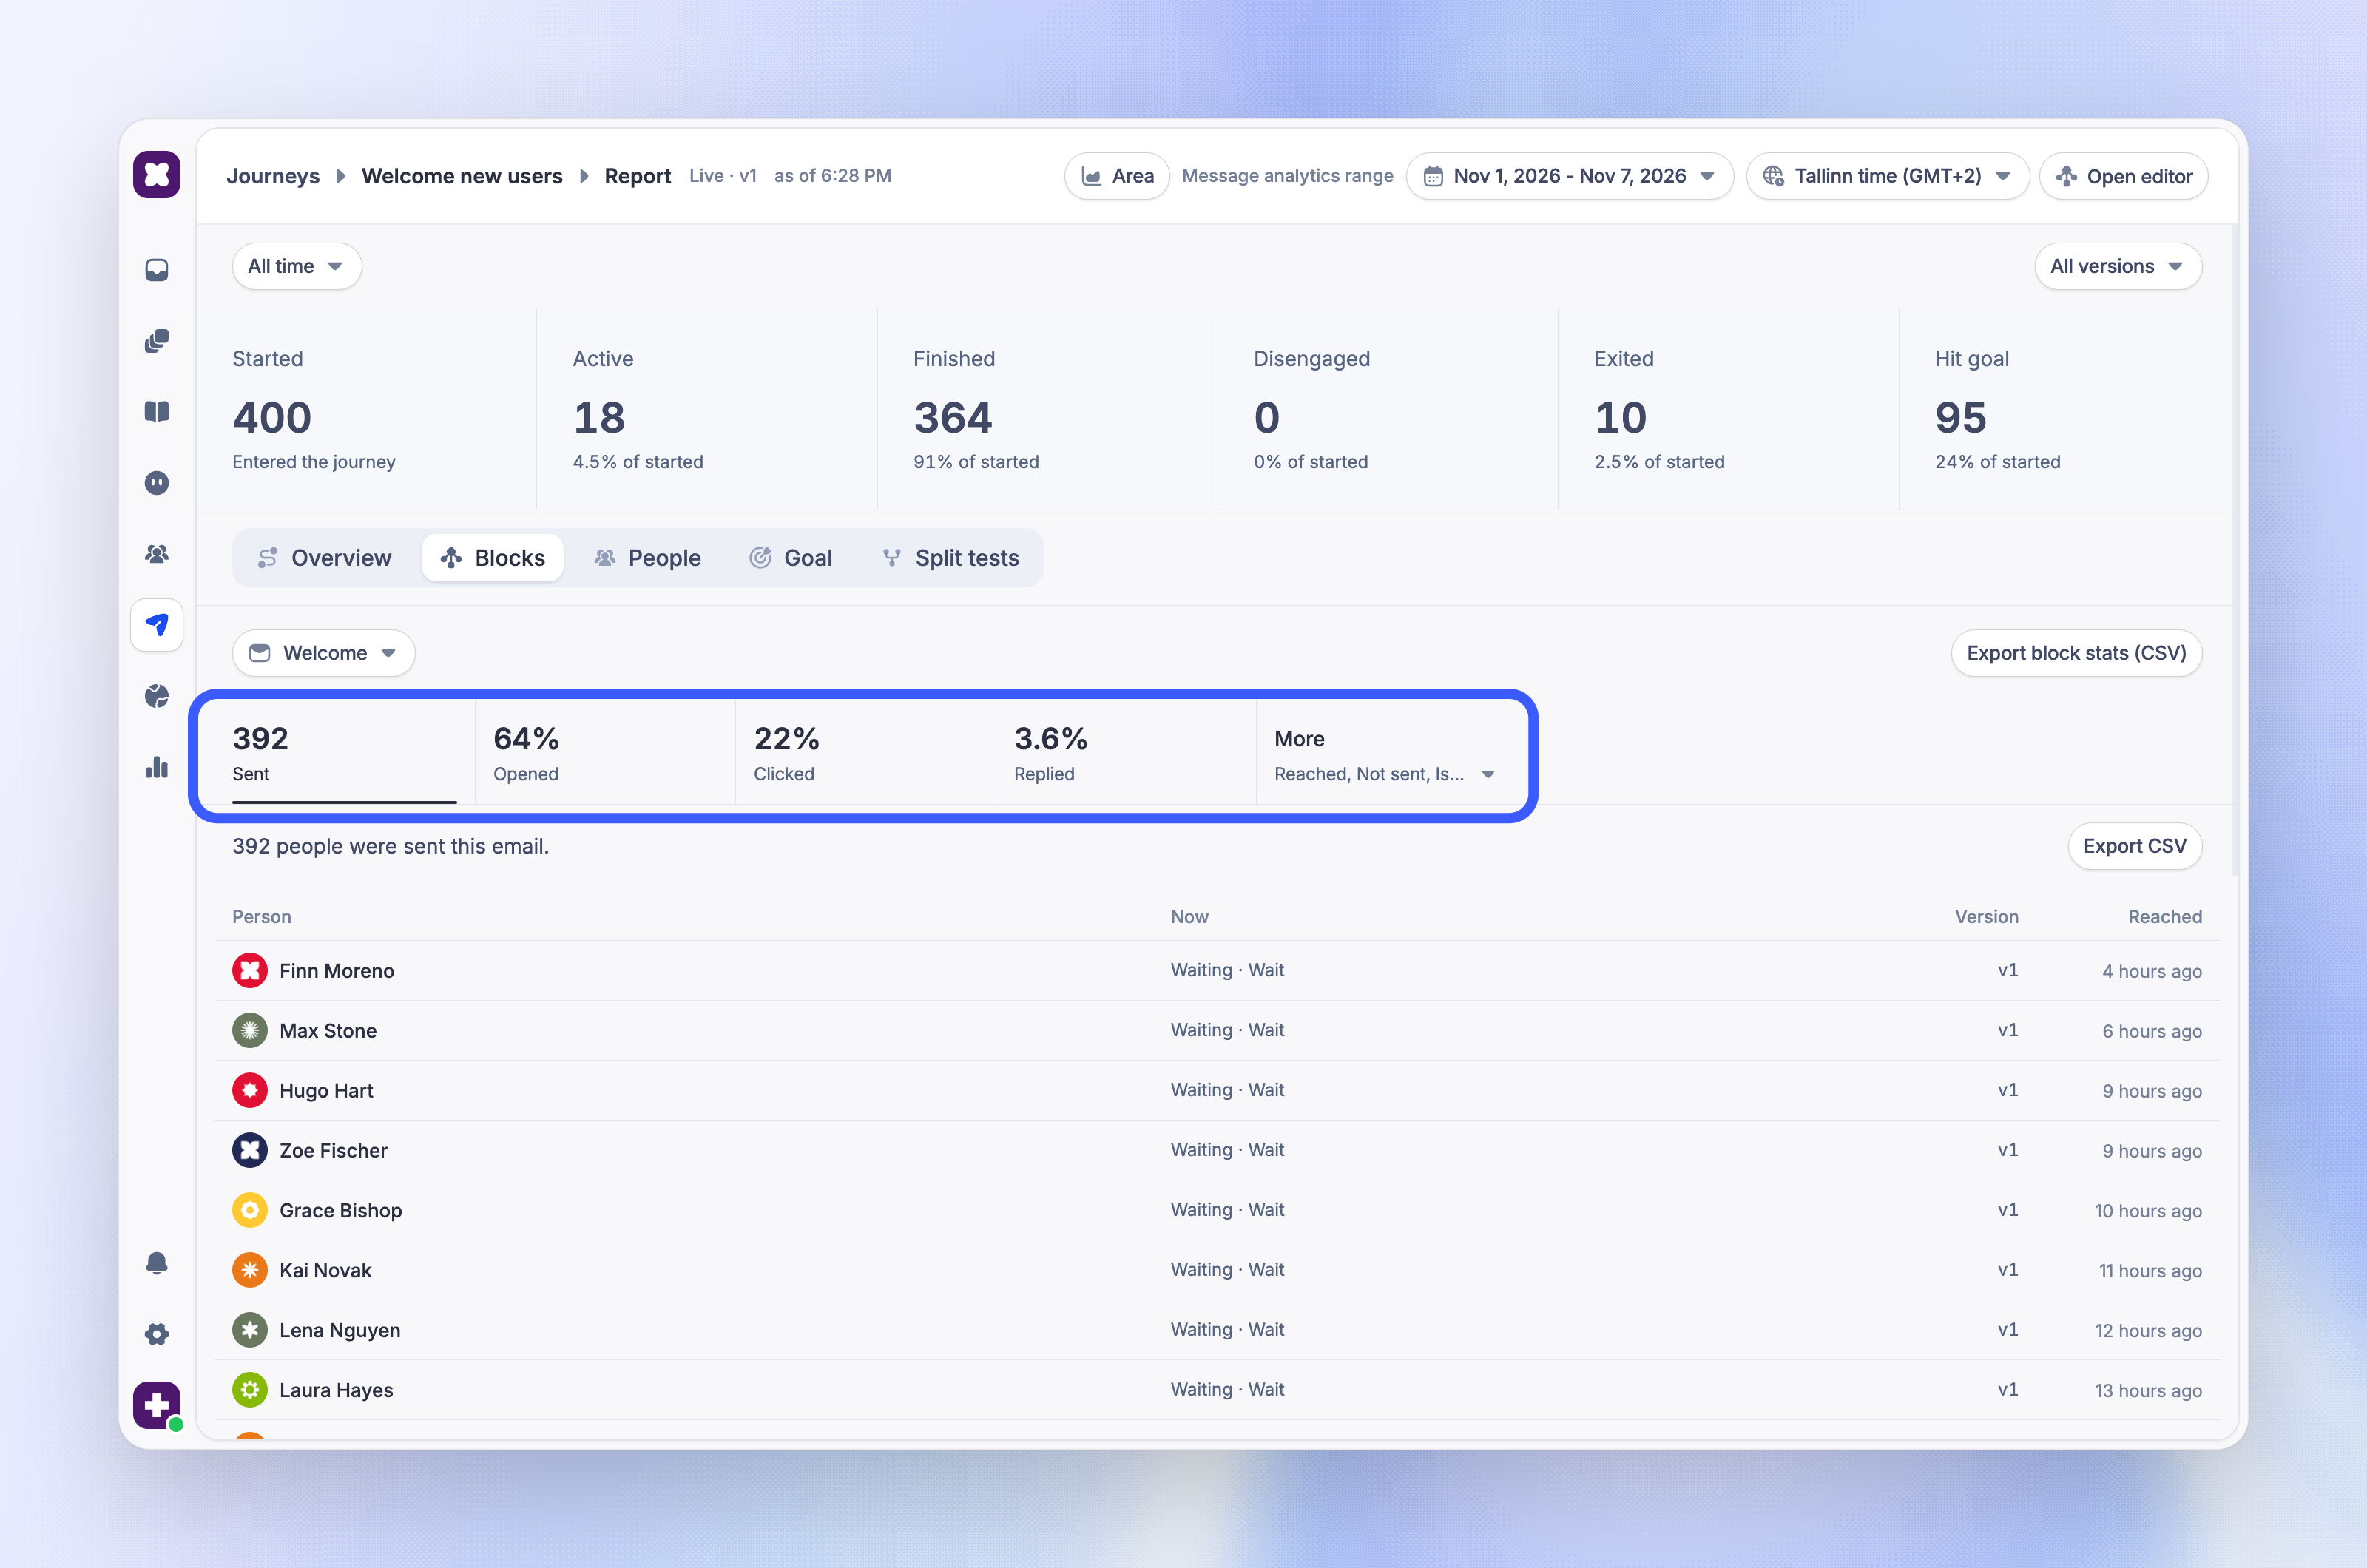
Pick a block from the menu to see the same tiles as in its stats sheet. Message blocks also have a Report tab with the message analytics you know from standalone Outbound messages. For a survey, the Responded tab lists the answers.
Flow numbers count people by the date they entered the journey. Opens, clicks, and replies count by the date of that action. Message analytics and survey answers include every version of the block.
People tab
The People tab lists everyone in the selected scope with their Version and the block they Reached. Filter by status (Active, Finished, Exited, Disengaged, Failed, Removed, or Hit goal) or pick an end reason, such as Matched an exit rule or Delivery failed. Click a person to open their journey path.
Each end reason belongs to one status:
Without the View Users permission, the tab shows People are hidden.
Goal tab
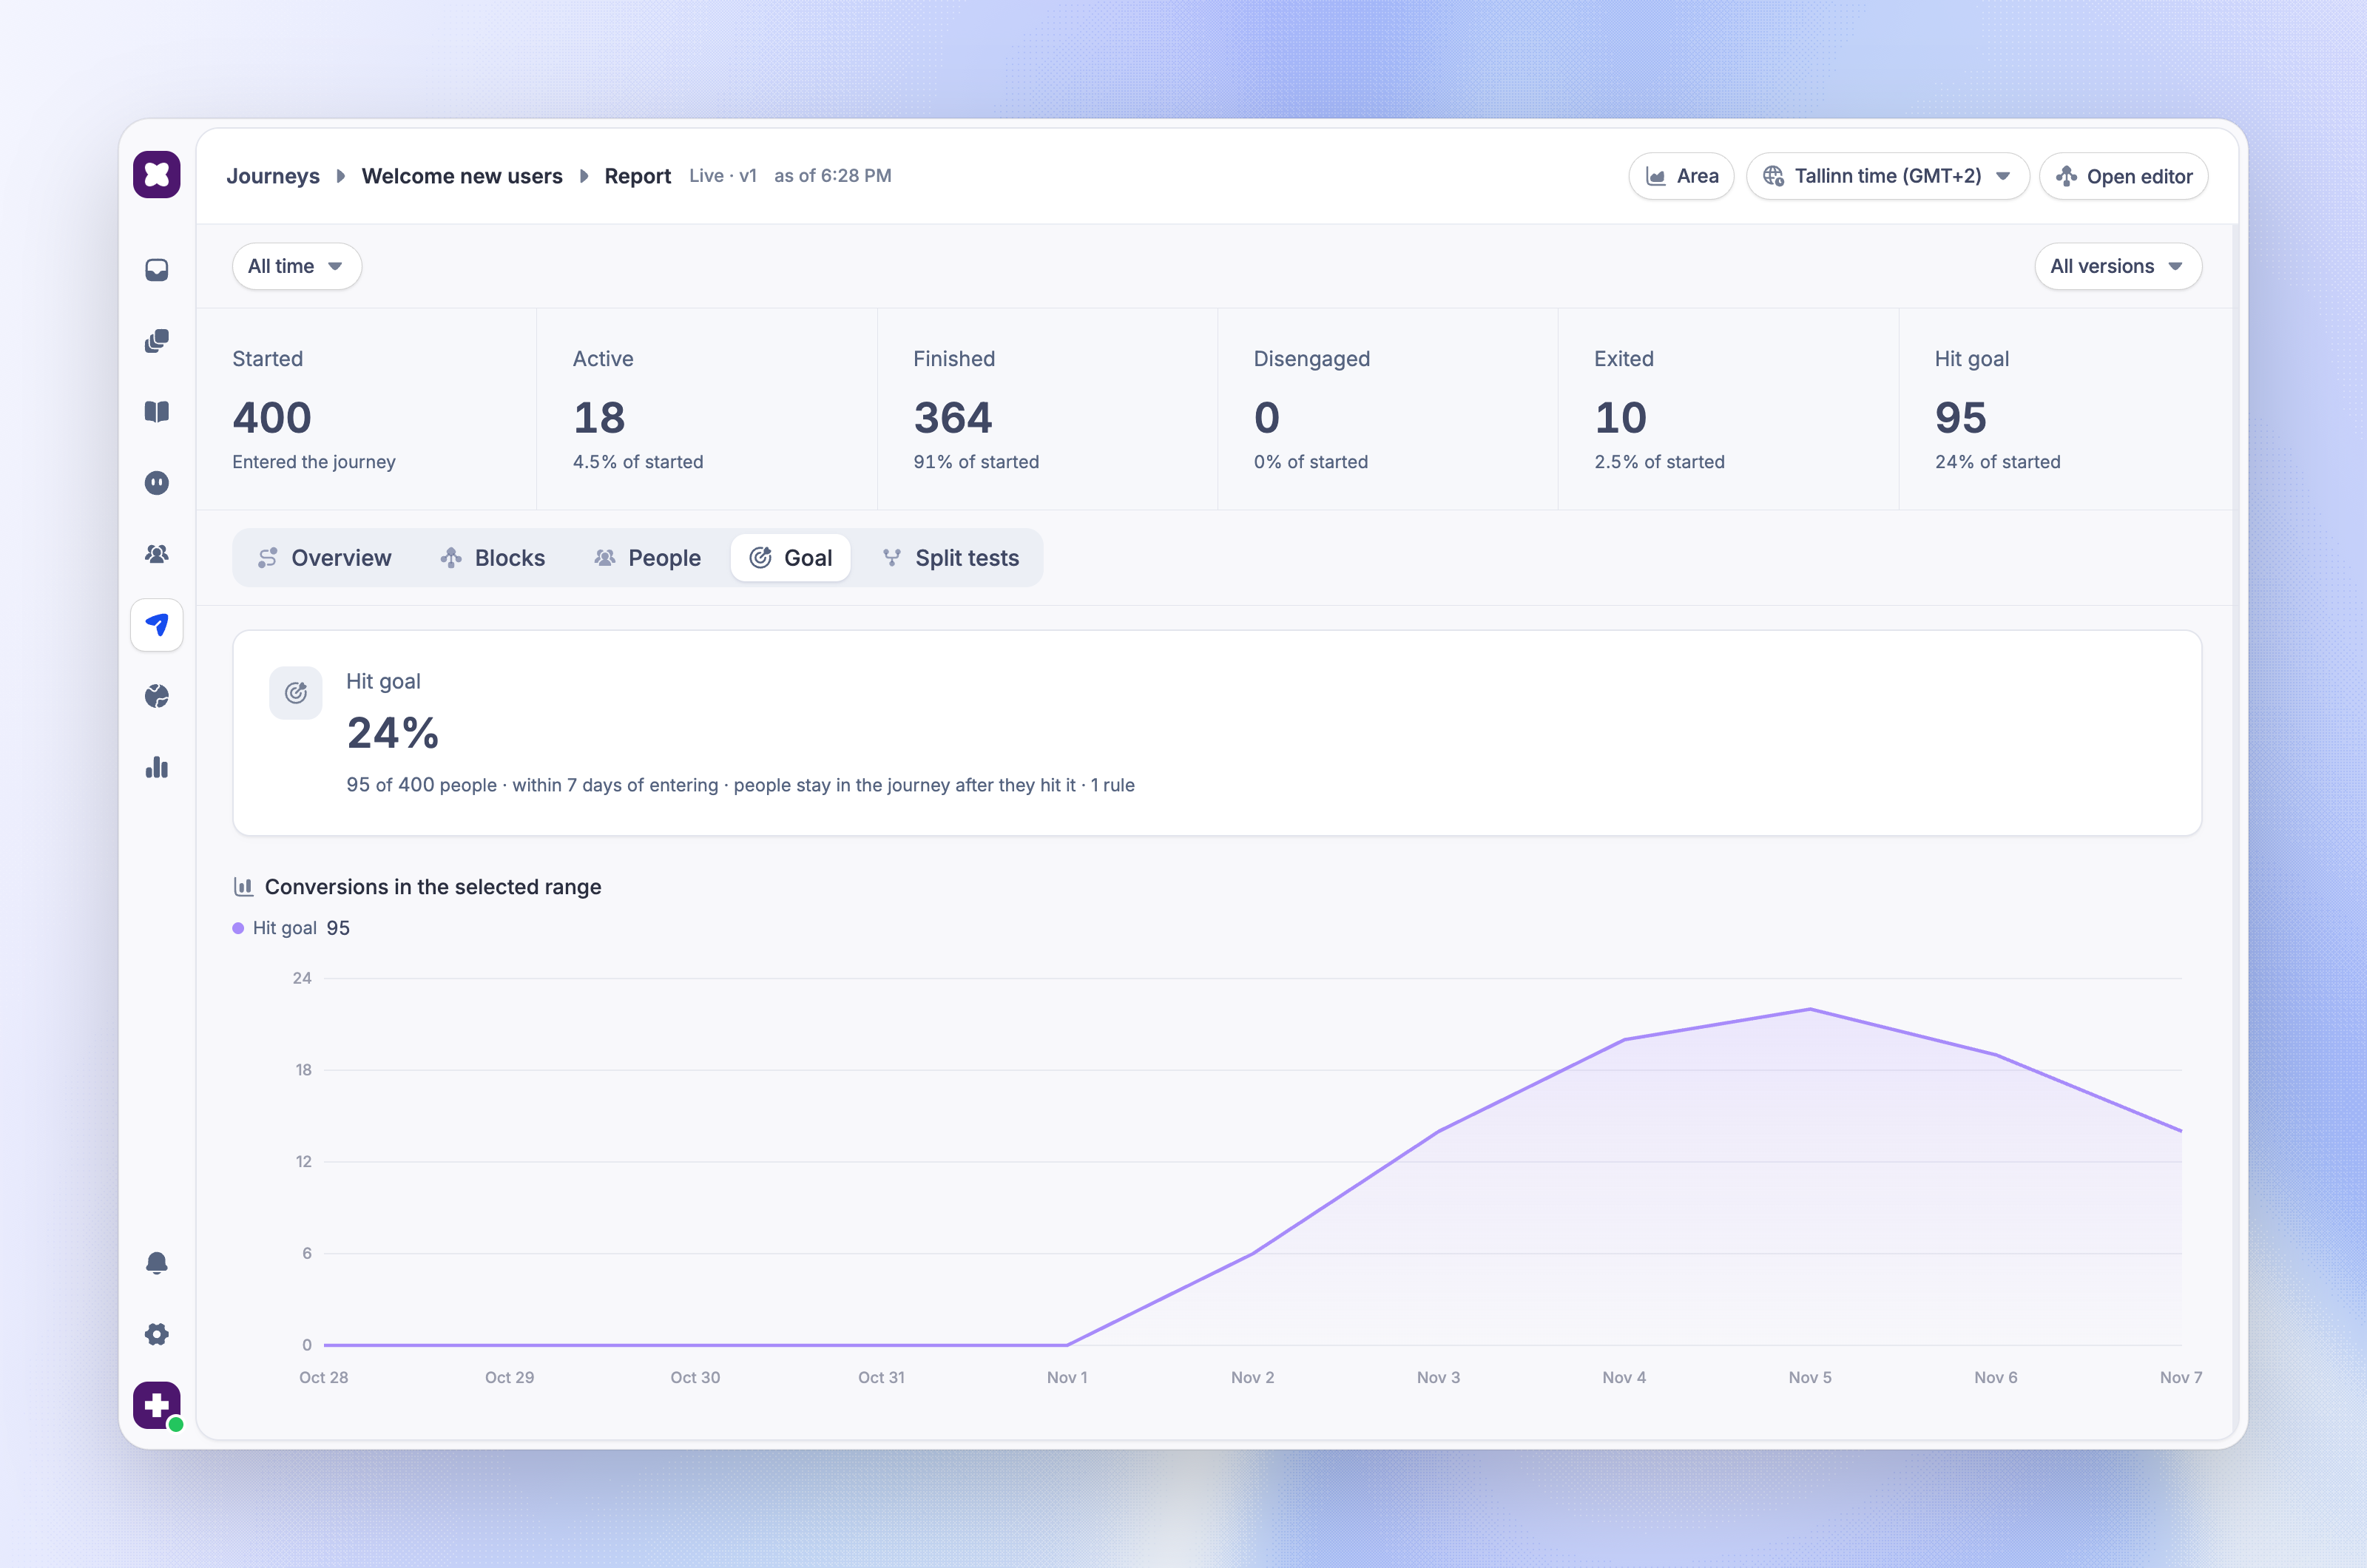
The Goal tab shows how many people reached the goal and a chart of Conversions in the selected range. The goal rate in the journey list is the same number: people who hit the goal divided by people who started.
If the journey has no goal, the tab shows No goal set. Set one in the journey settings.
Split tests tab
This tab appears only when the live version has a split test. It compares each path's share, people, goal rate, and confidence, and lets you pick a winner. Split test results ignore the range and version pickers. See Split testing in journeys.
Export report data
A people export includes up to 50,000 rows. It needs both the Manage Outbound and View Users permissions. Click 'Download last export' to download the most recent file again during the same visit.
Note: Only one people export can run at a time. If an export link has expired, export again.
FAQs
Why can't I open the report?
Why can't I open the report?
The journey has not been published yet. Reports show data for published versions only.
Why do email opens and clicks show zero?
Why do email opens and clicks show zero?
Opens and clicks are not tracked for emails sent from the default Featurebase address. Add your own sending domain to track them. Free and new workspaces also send without tracking: it starts on a paid plan once the workspace is 30 days old. Some mail apps open emails automatically, and those opens are not counted.
Why do Blocks tab numbers differ from the message analytics?
Why do Blocks tab numbers differ from the message analytics?
The counts at the top use the report range and version, and count people by the date they entered. The message analytics include every version of the block and use their own date range.
Do test sends appear in the report?
Do test sends appear in the report?
No. Test sends are excluded from the counts, the people list, and the exports.
Was this helpful?
Still need help? Ask the team