Reports overview
Use Featurebase Reports to spot changes, understand what drives them, and share customer service insights with your team.
Written By Markus Palm
Last updated About 21 hours ago
Overview
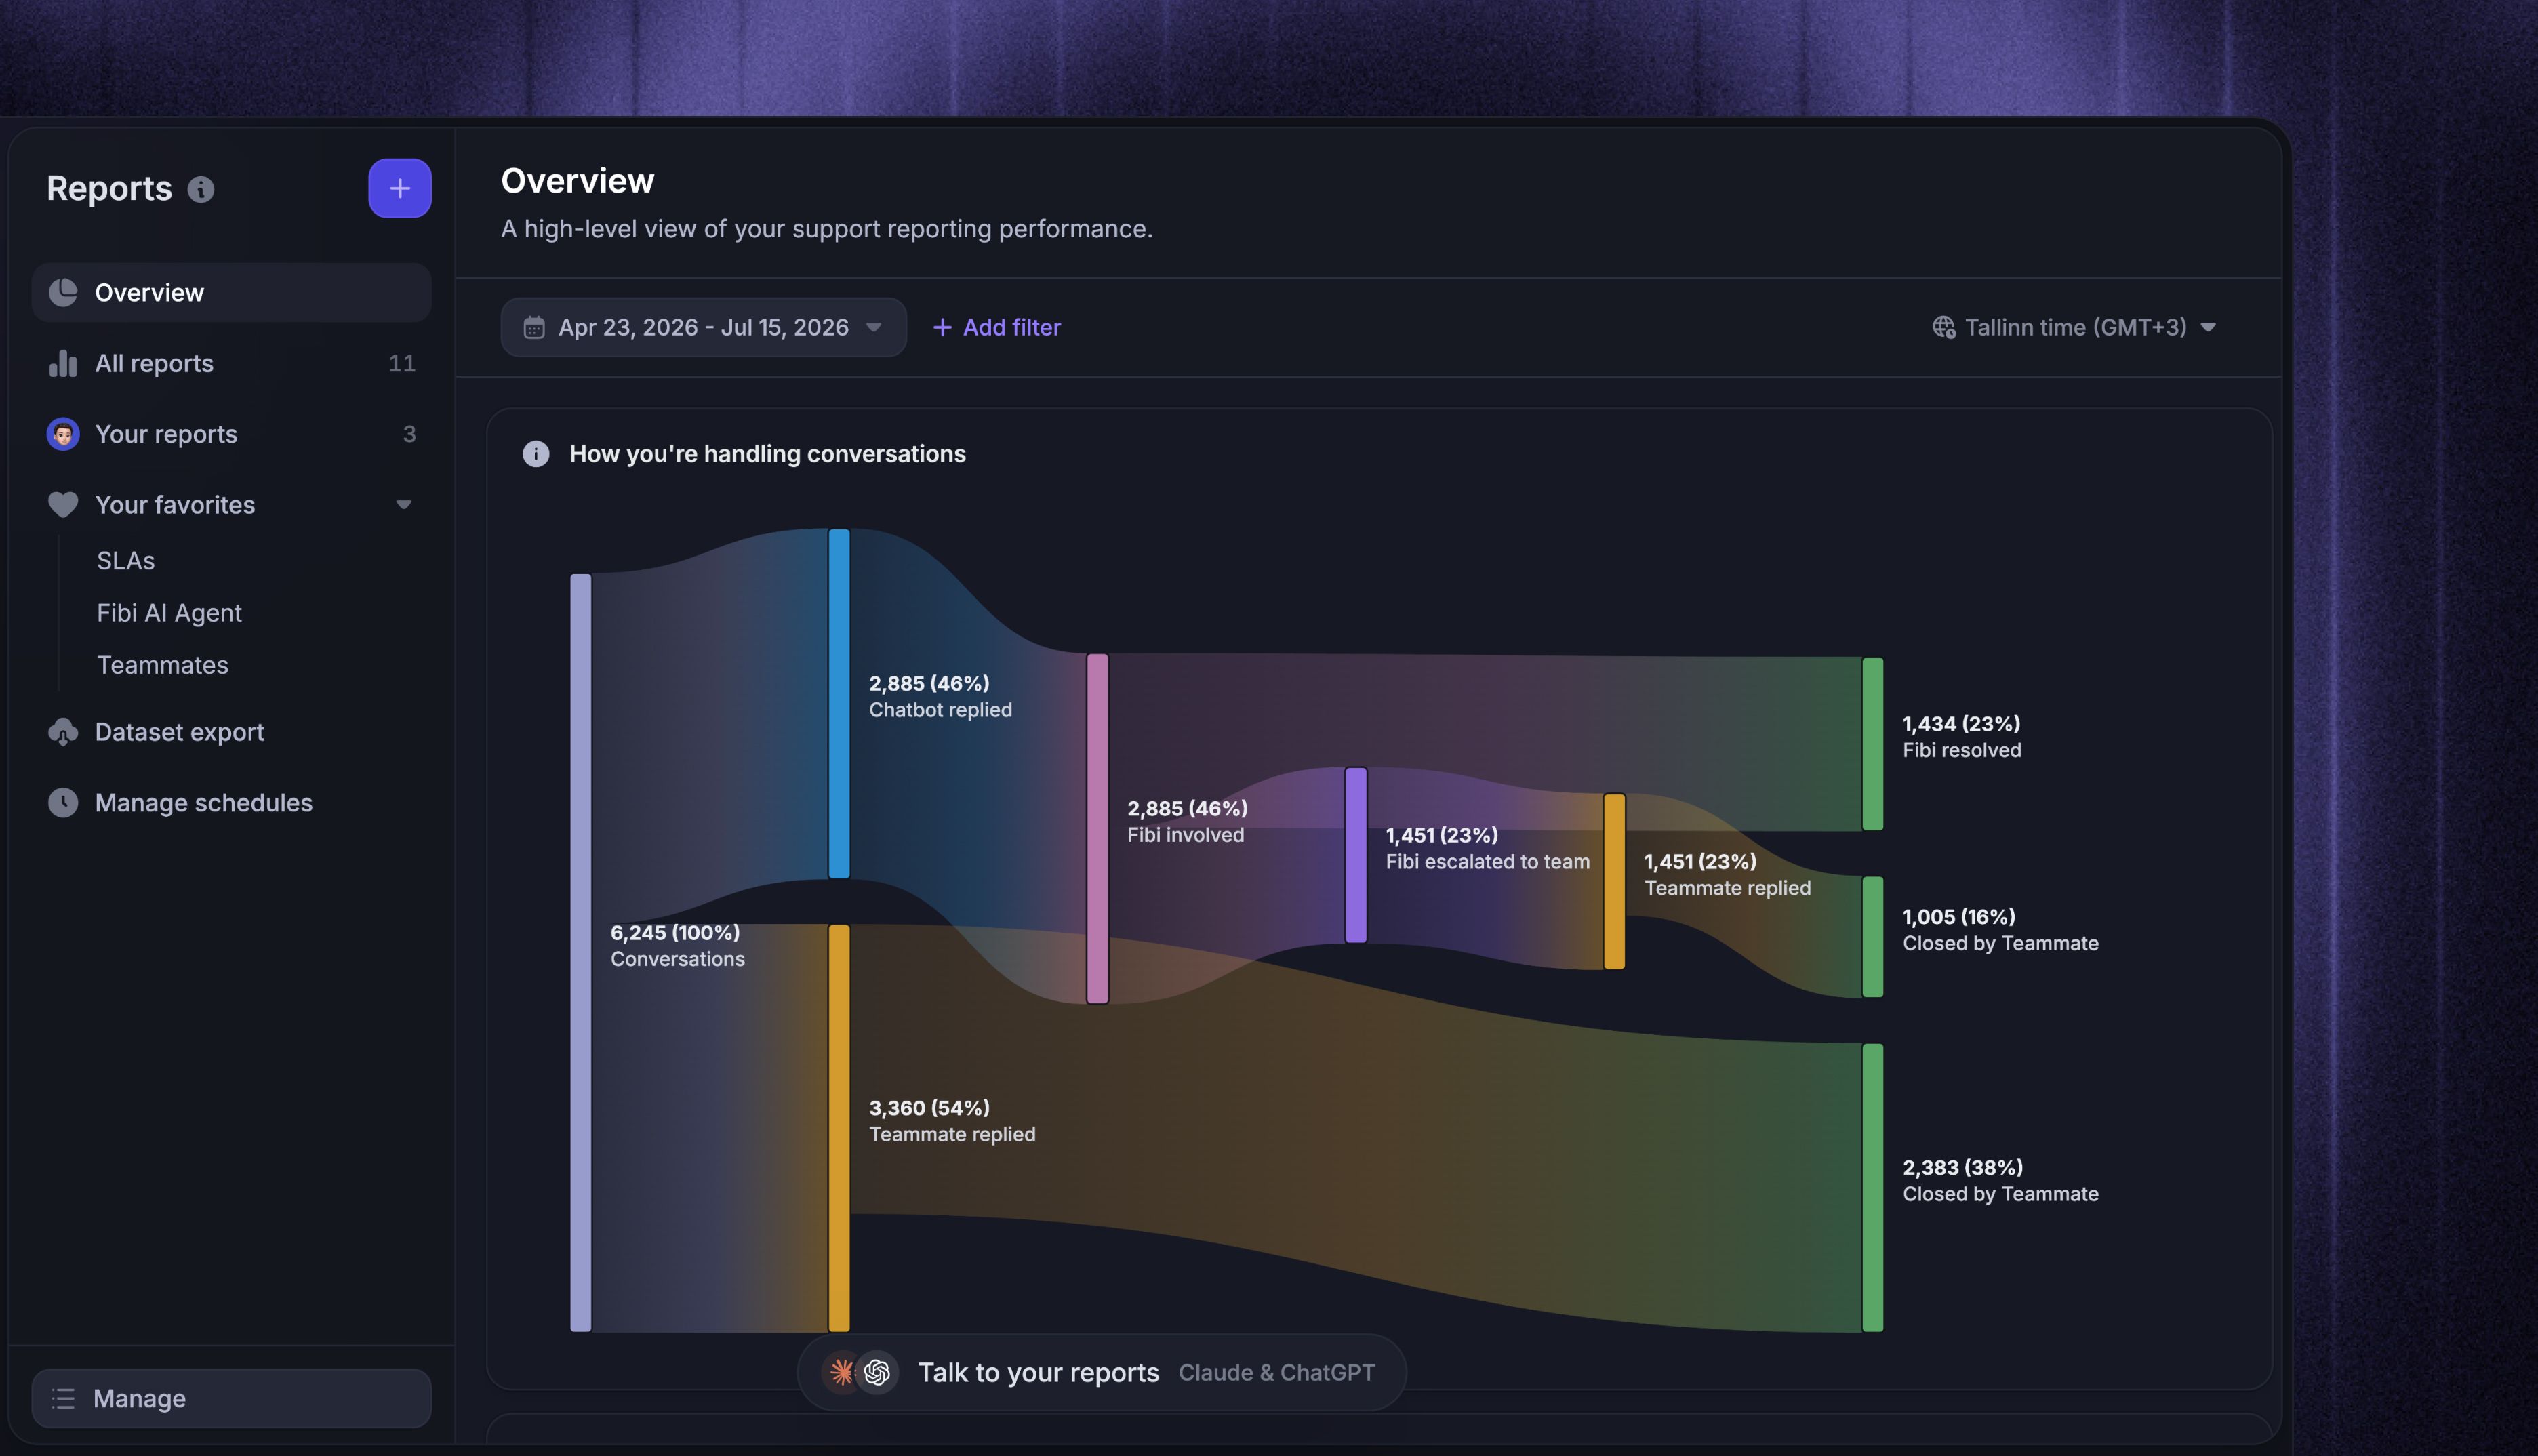
Featurebase Reports gives you one place to monitor, analyze, and improve your entire customer service operation. It brings together conversations, Fibi AI Agent, Copilot, SLAs, tickets, and CSAT, then lets you drill into any number to see the data behind it - helping you spot changes, understand what caused them, and decide what to improve.
Use Reports to answer questions like:
Where is demand changing? - compare conversation and ticket volume across channels, teams, tags, and customer segments
How well are Fibi and your team performing? - track resolution, response speed, handling time, and customer satisfaction
What is driving a result? - move from a spike or drop into the underlying conversations, replies, ratings, and tickets
What should the team review regularly? - build focused reports, share them with the right people, and schedule recurring snapshots
Open Reports to get started.
Tip: Use Featurebase MCP to ask Claude, ChatGPT, etc. questions about your support data, investigate trends, and turn your data into tailored analyses and artifacts.
Overview report
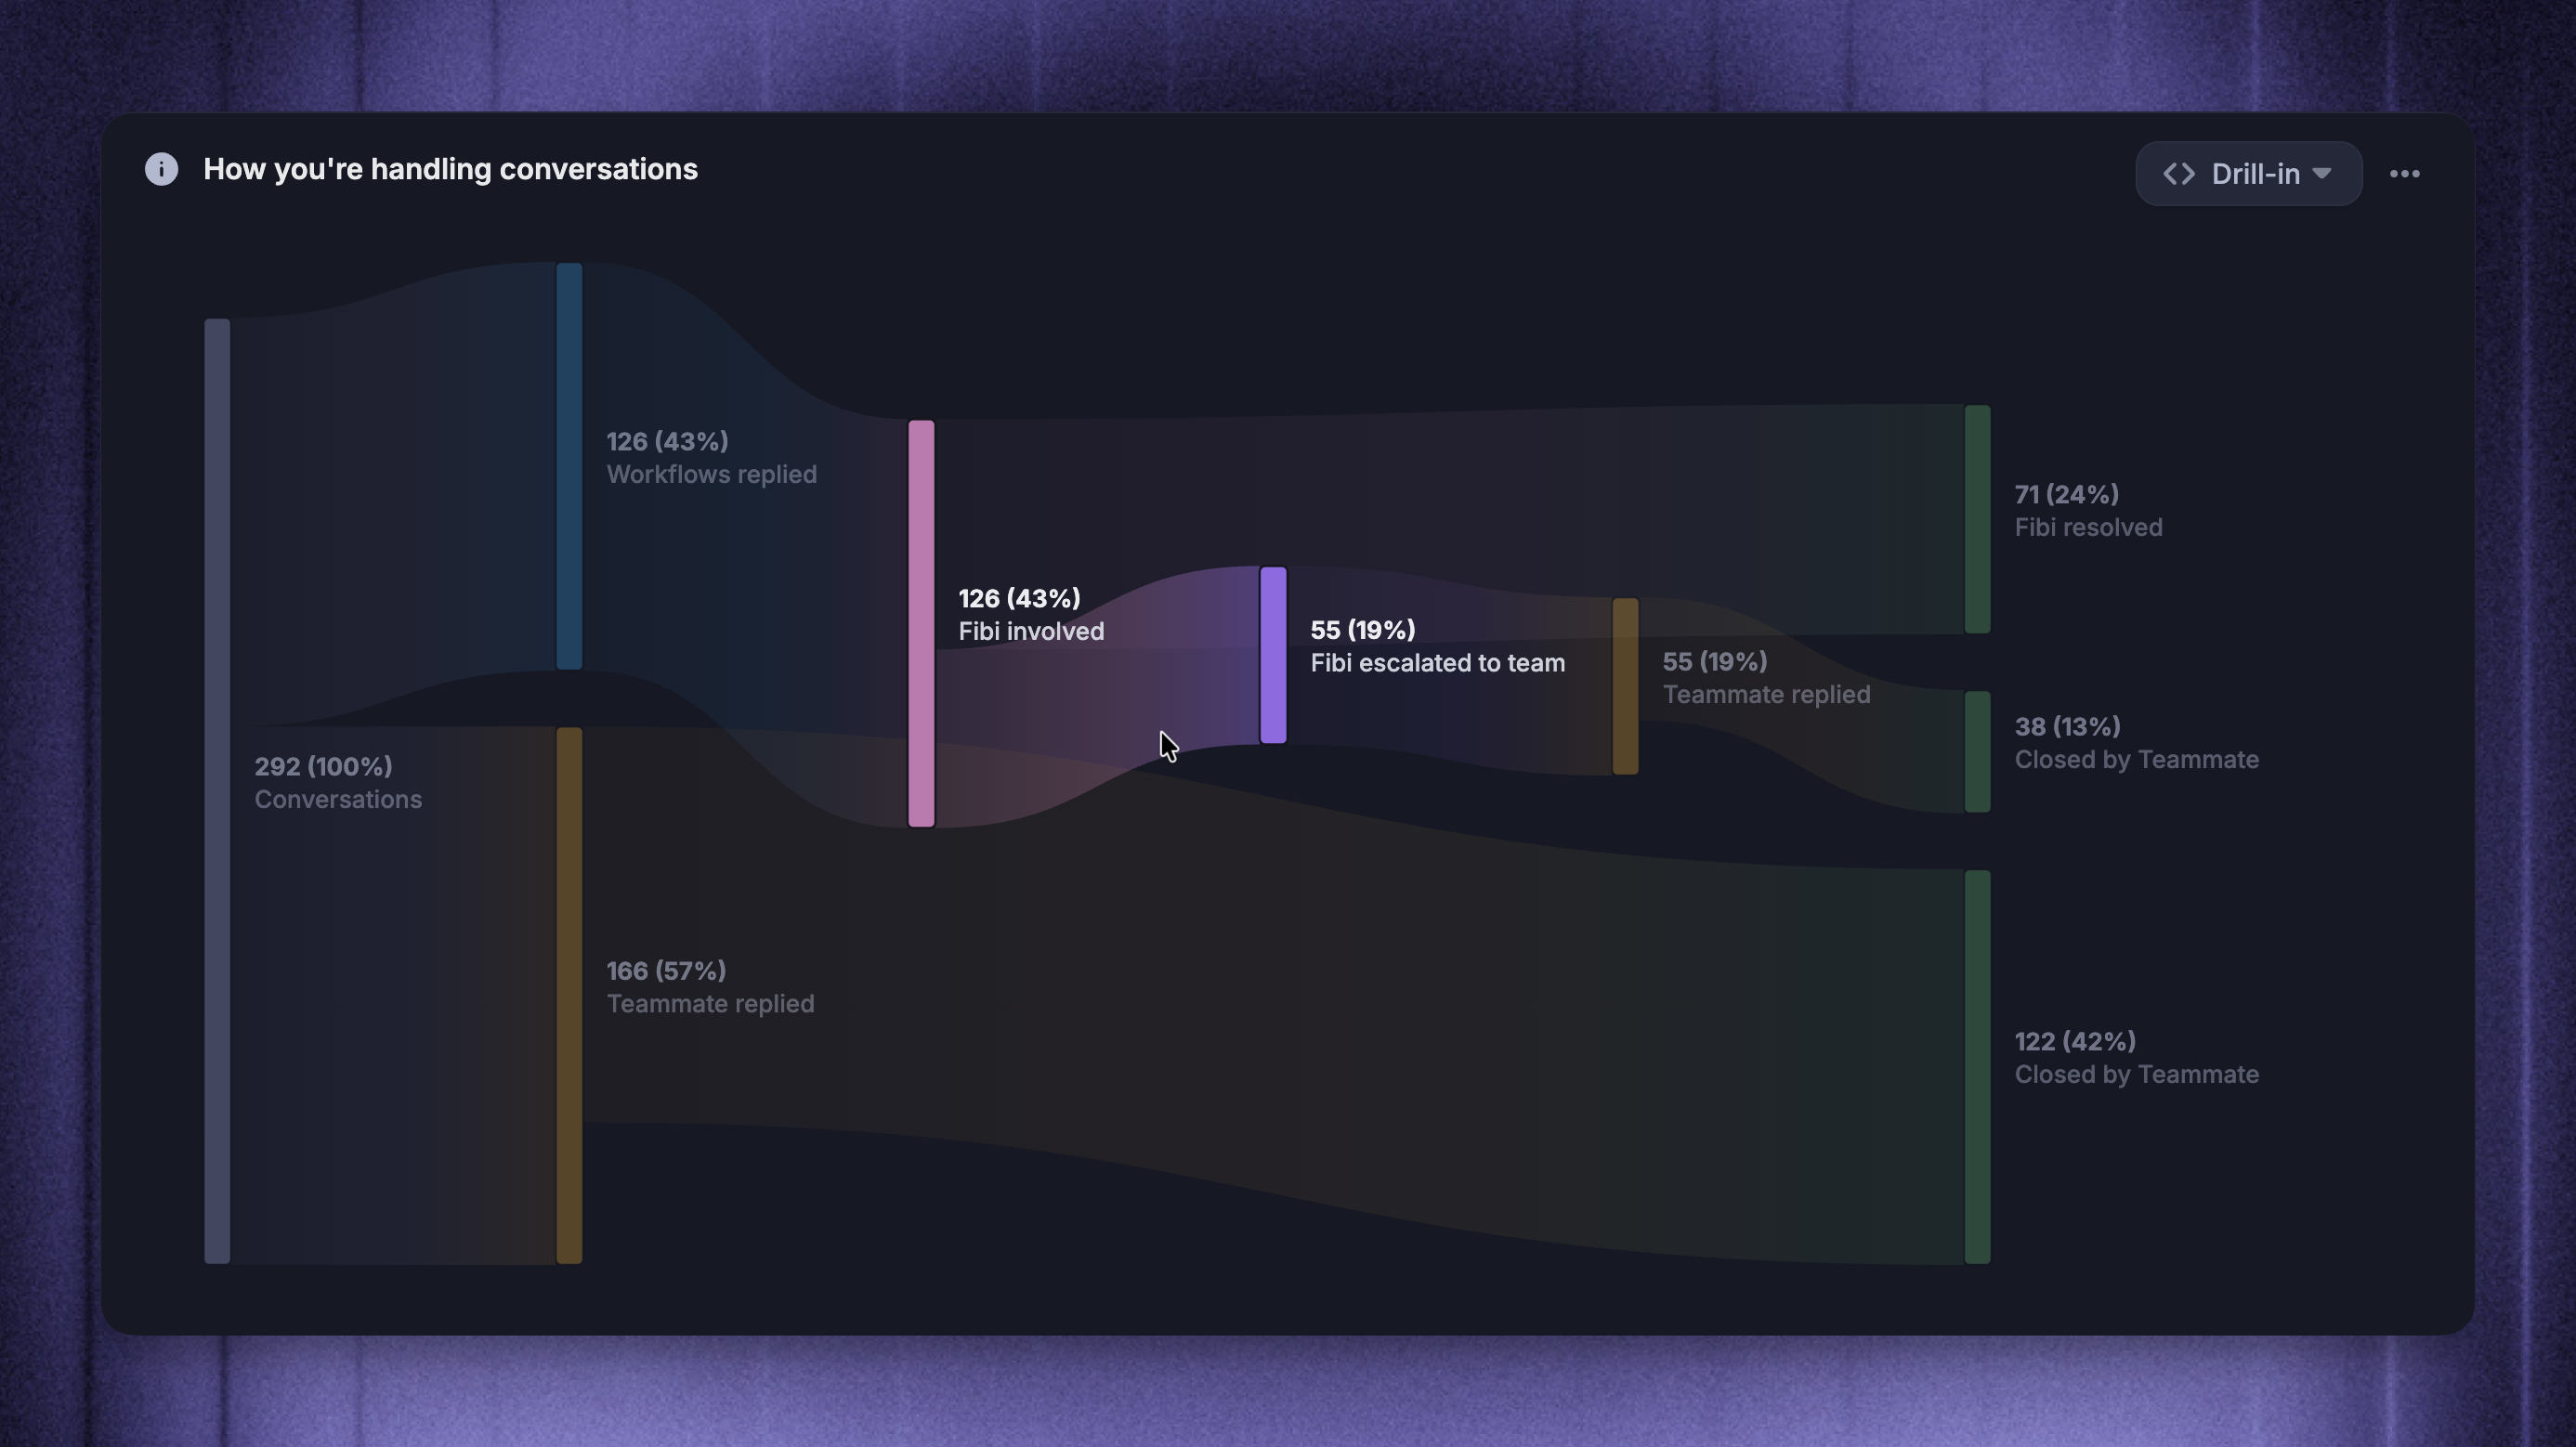
Reports opens on the dedicated Holistic overview report. It gives everyone the same high-level view of conversation volume, Fibi AI Agent impact, teammate speed, and surveyed CSAT, making it a useful starting point for a weekly health check.
Reporting templates
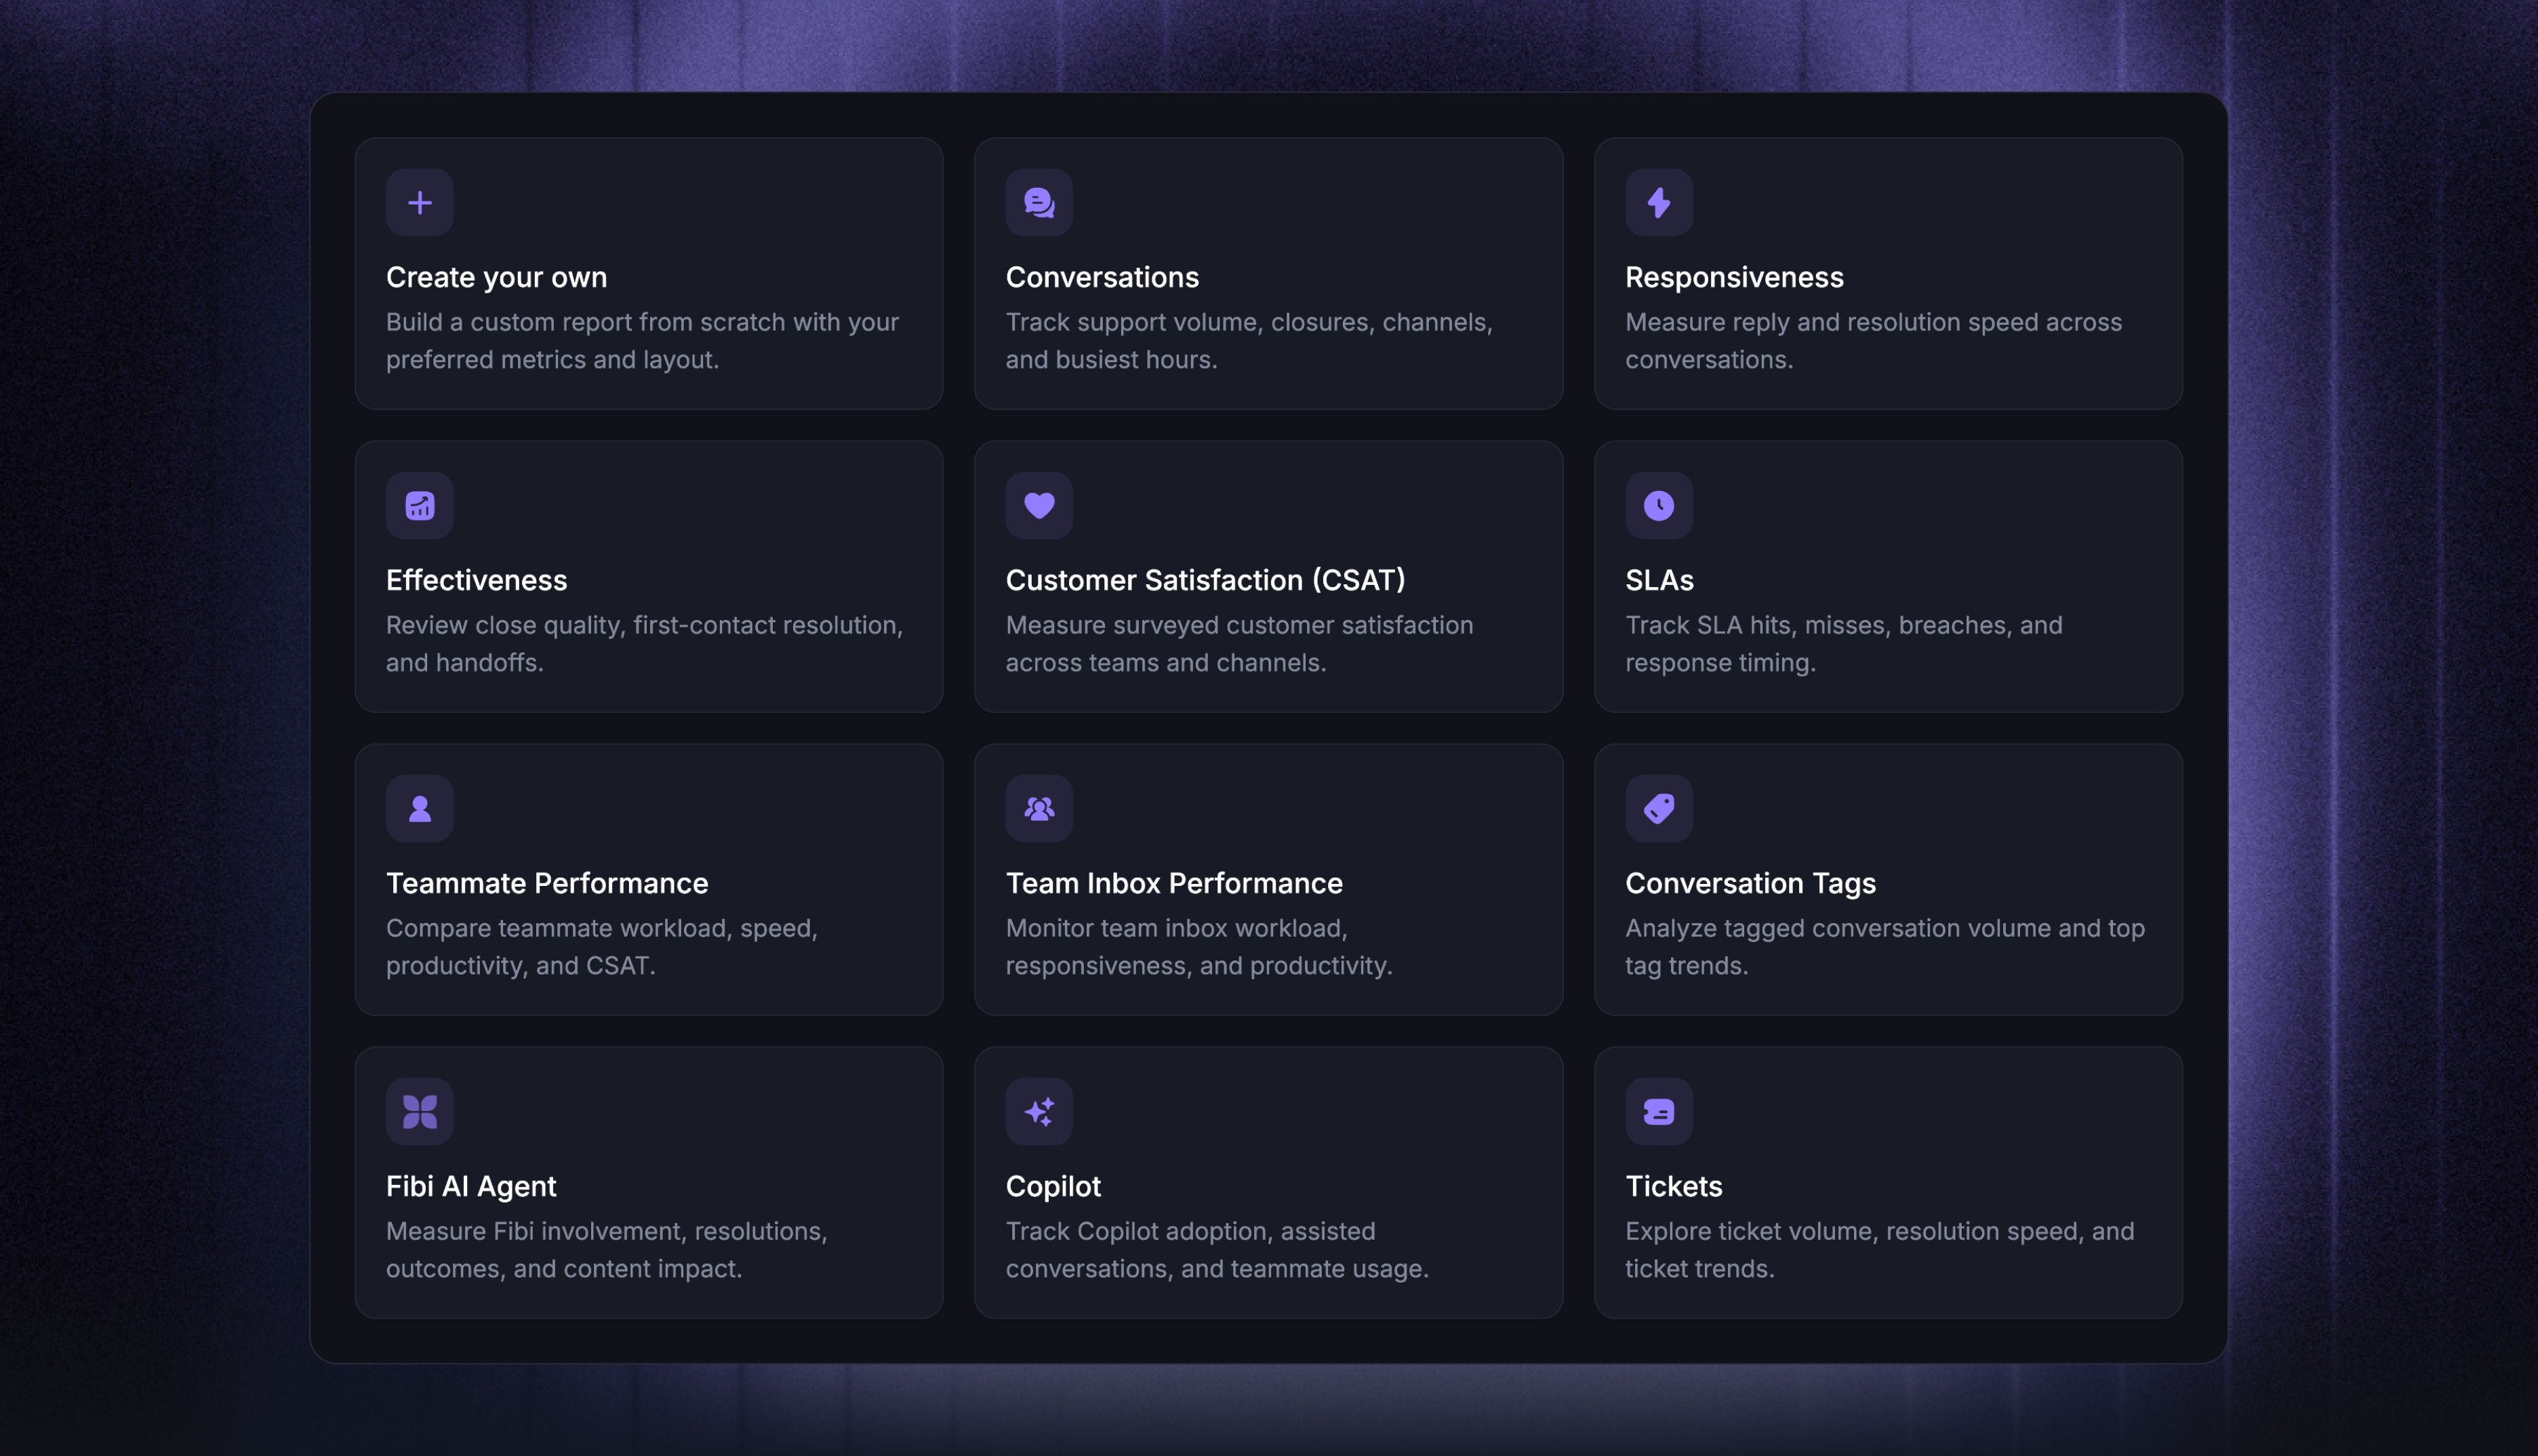
For a more focused question, open All reports and choose from 11 additional templates:
Open a template to preview its charts. Click Use this template to create an editable copy for your team.
Custom reports
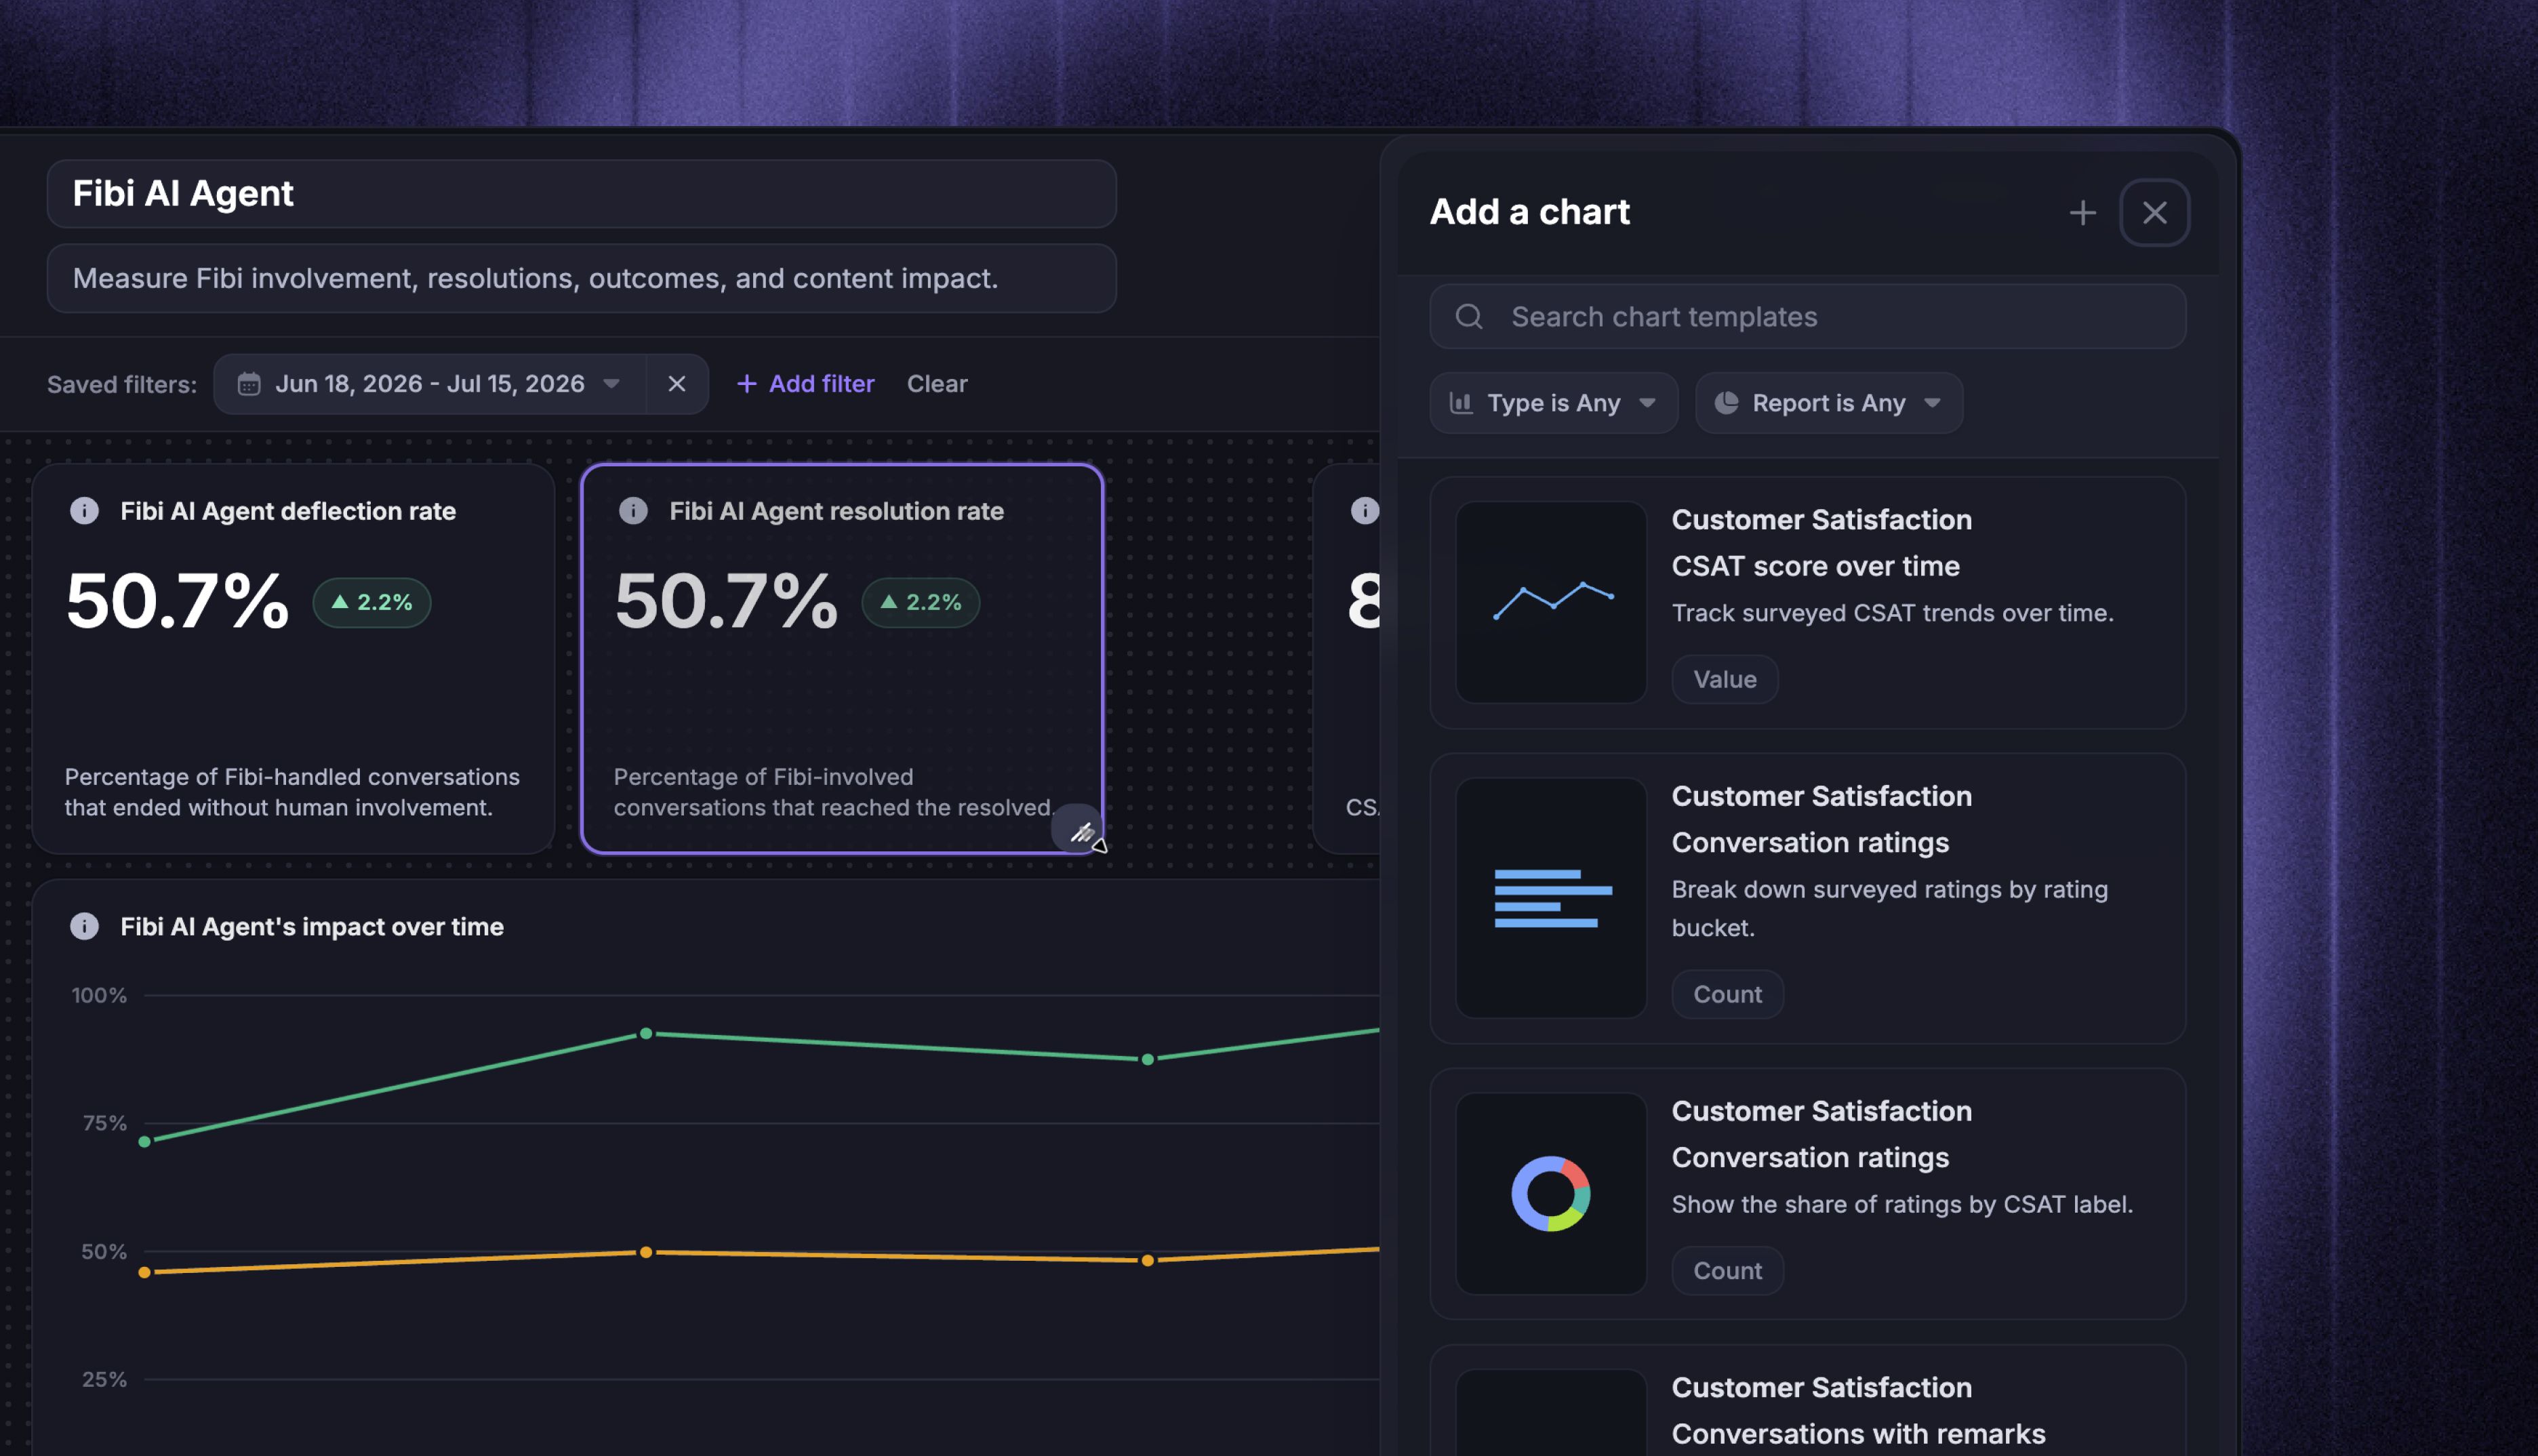
Templates cover common questions. Custom reports let you build around the exact decision your team needs to make, such as comparing CSAT by customer segment, following Fibi performance week over week, or reviewing response times for one channel or team.
This feature gives you the freedom to select exactly what data and visuals are most relevant to your needs.
Customize and explore reports
Customize charts and layout
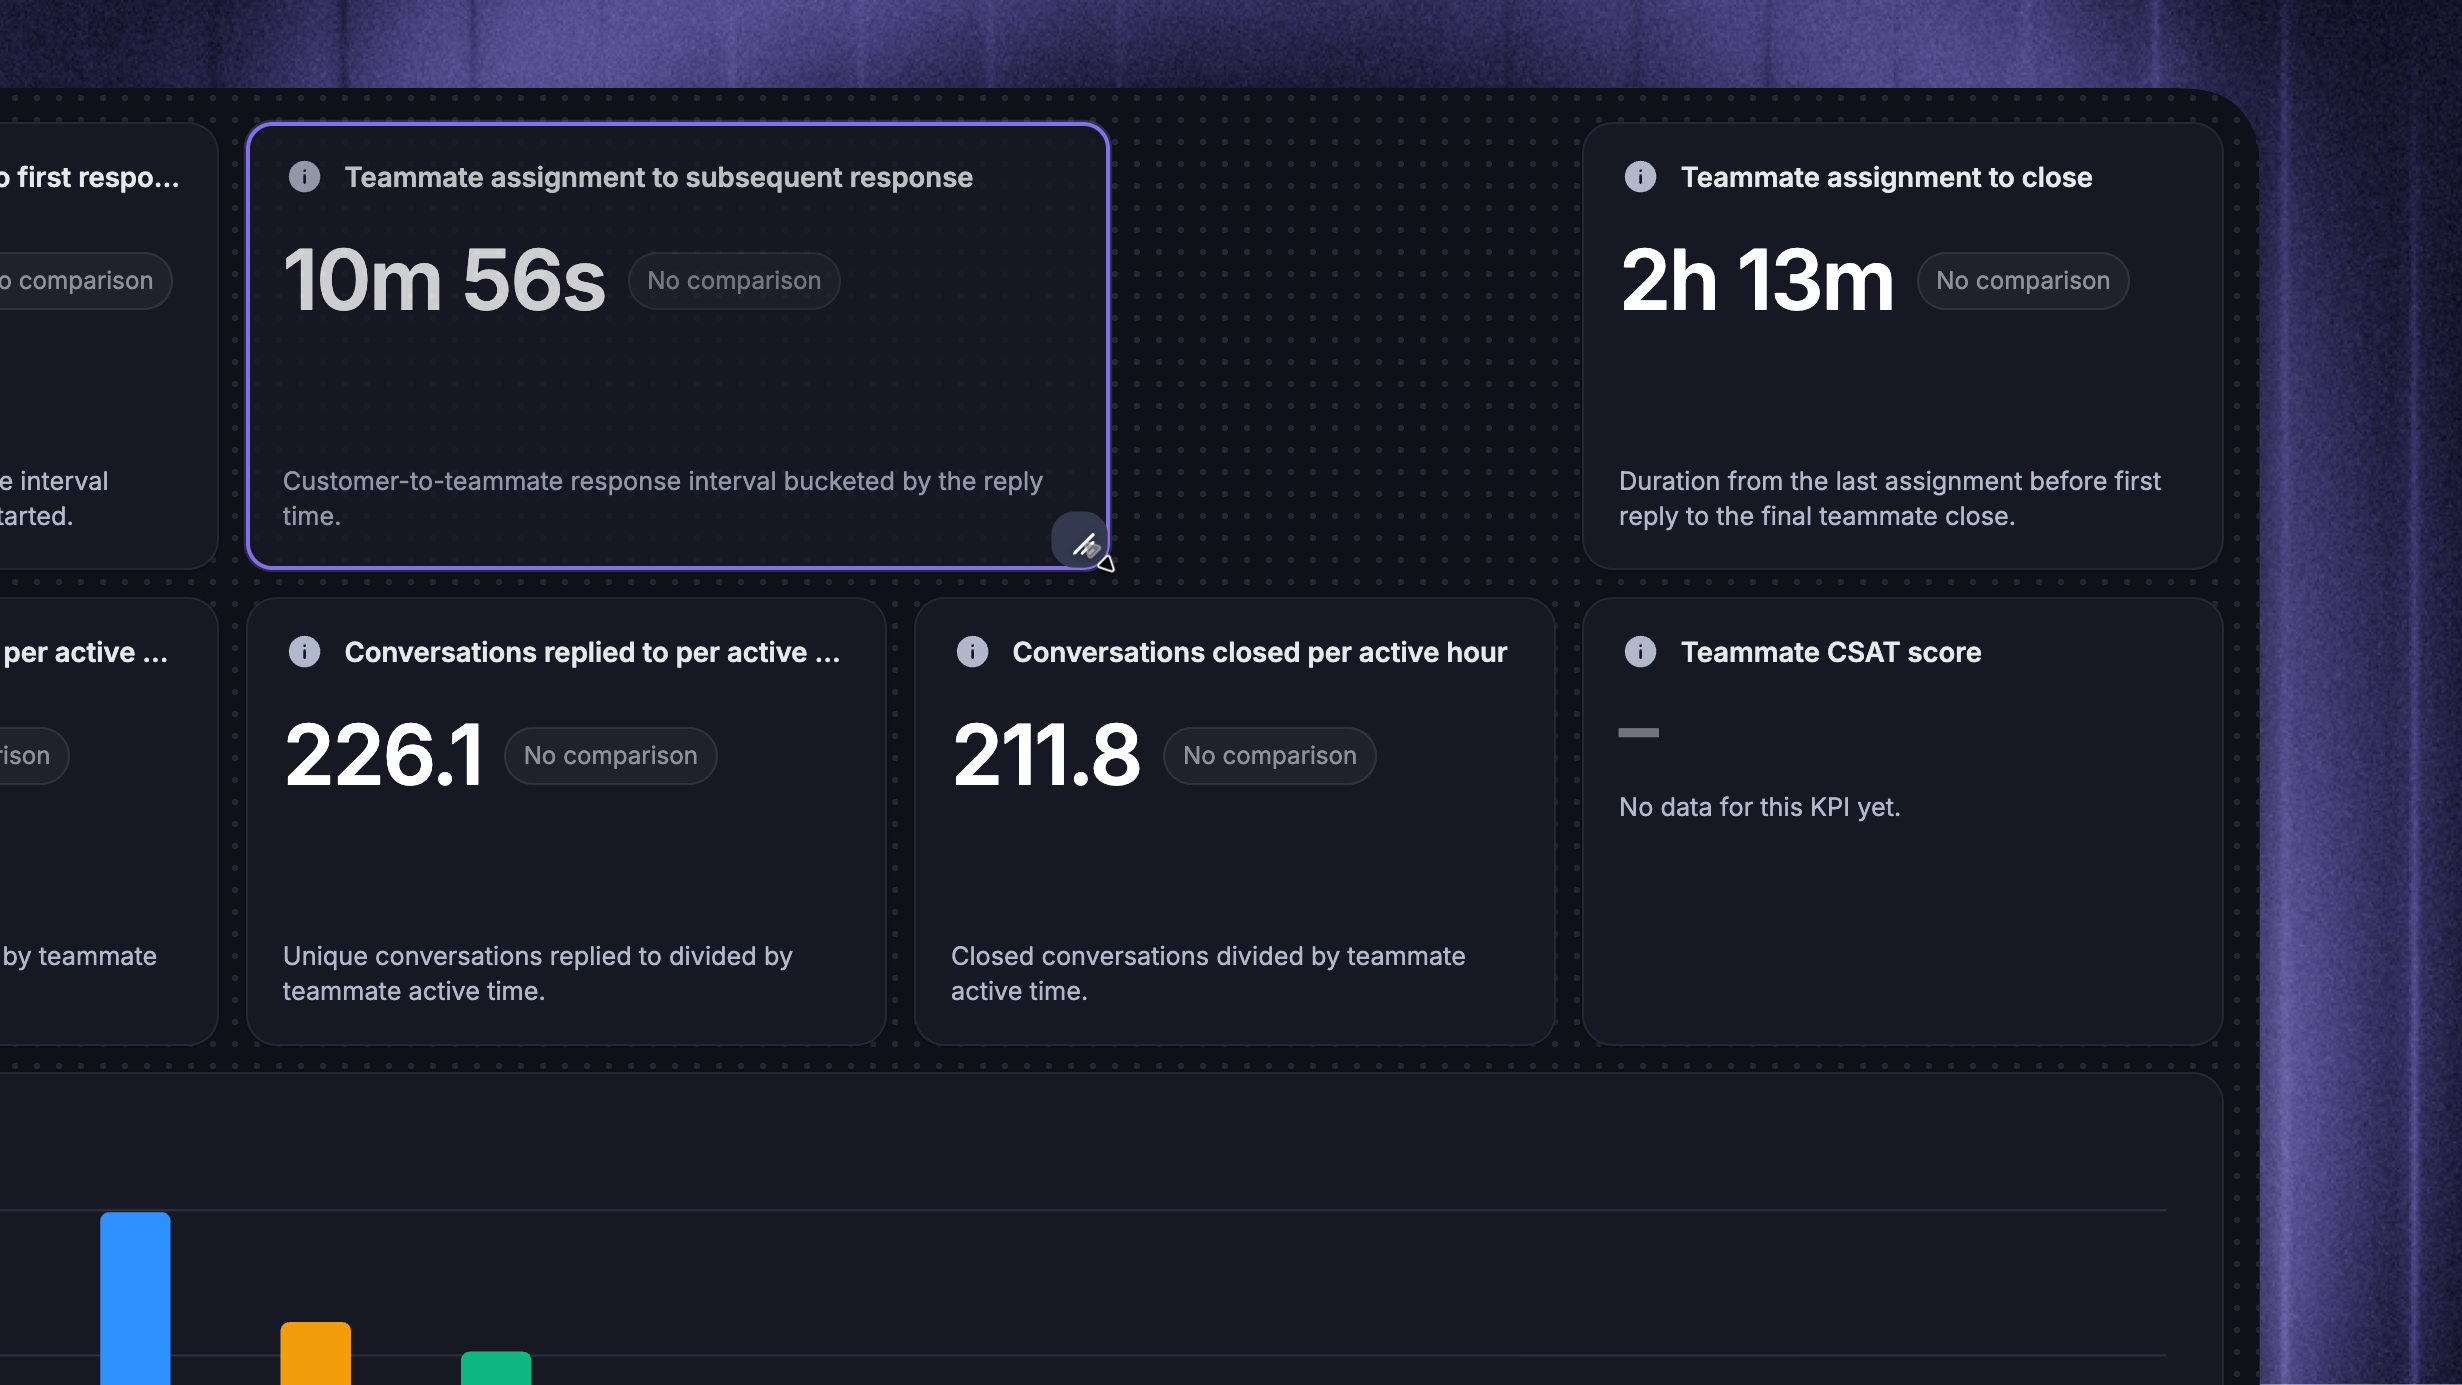
Add charts from the prebuilt catalog or create your own, then rearrange or resize them on the report canvas. Custom report chart types and options covers the available breakdowns, comparisons, and display settings.
Understand chart data
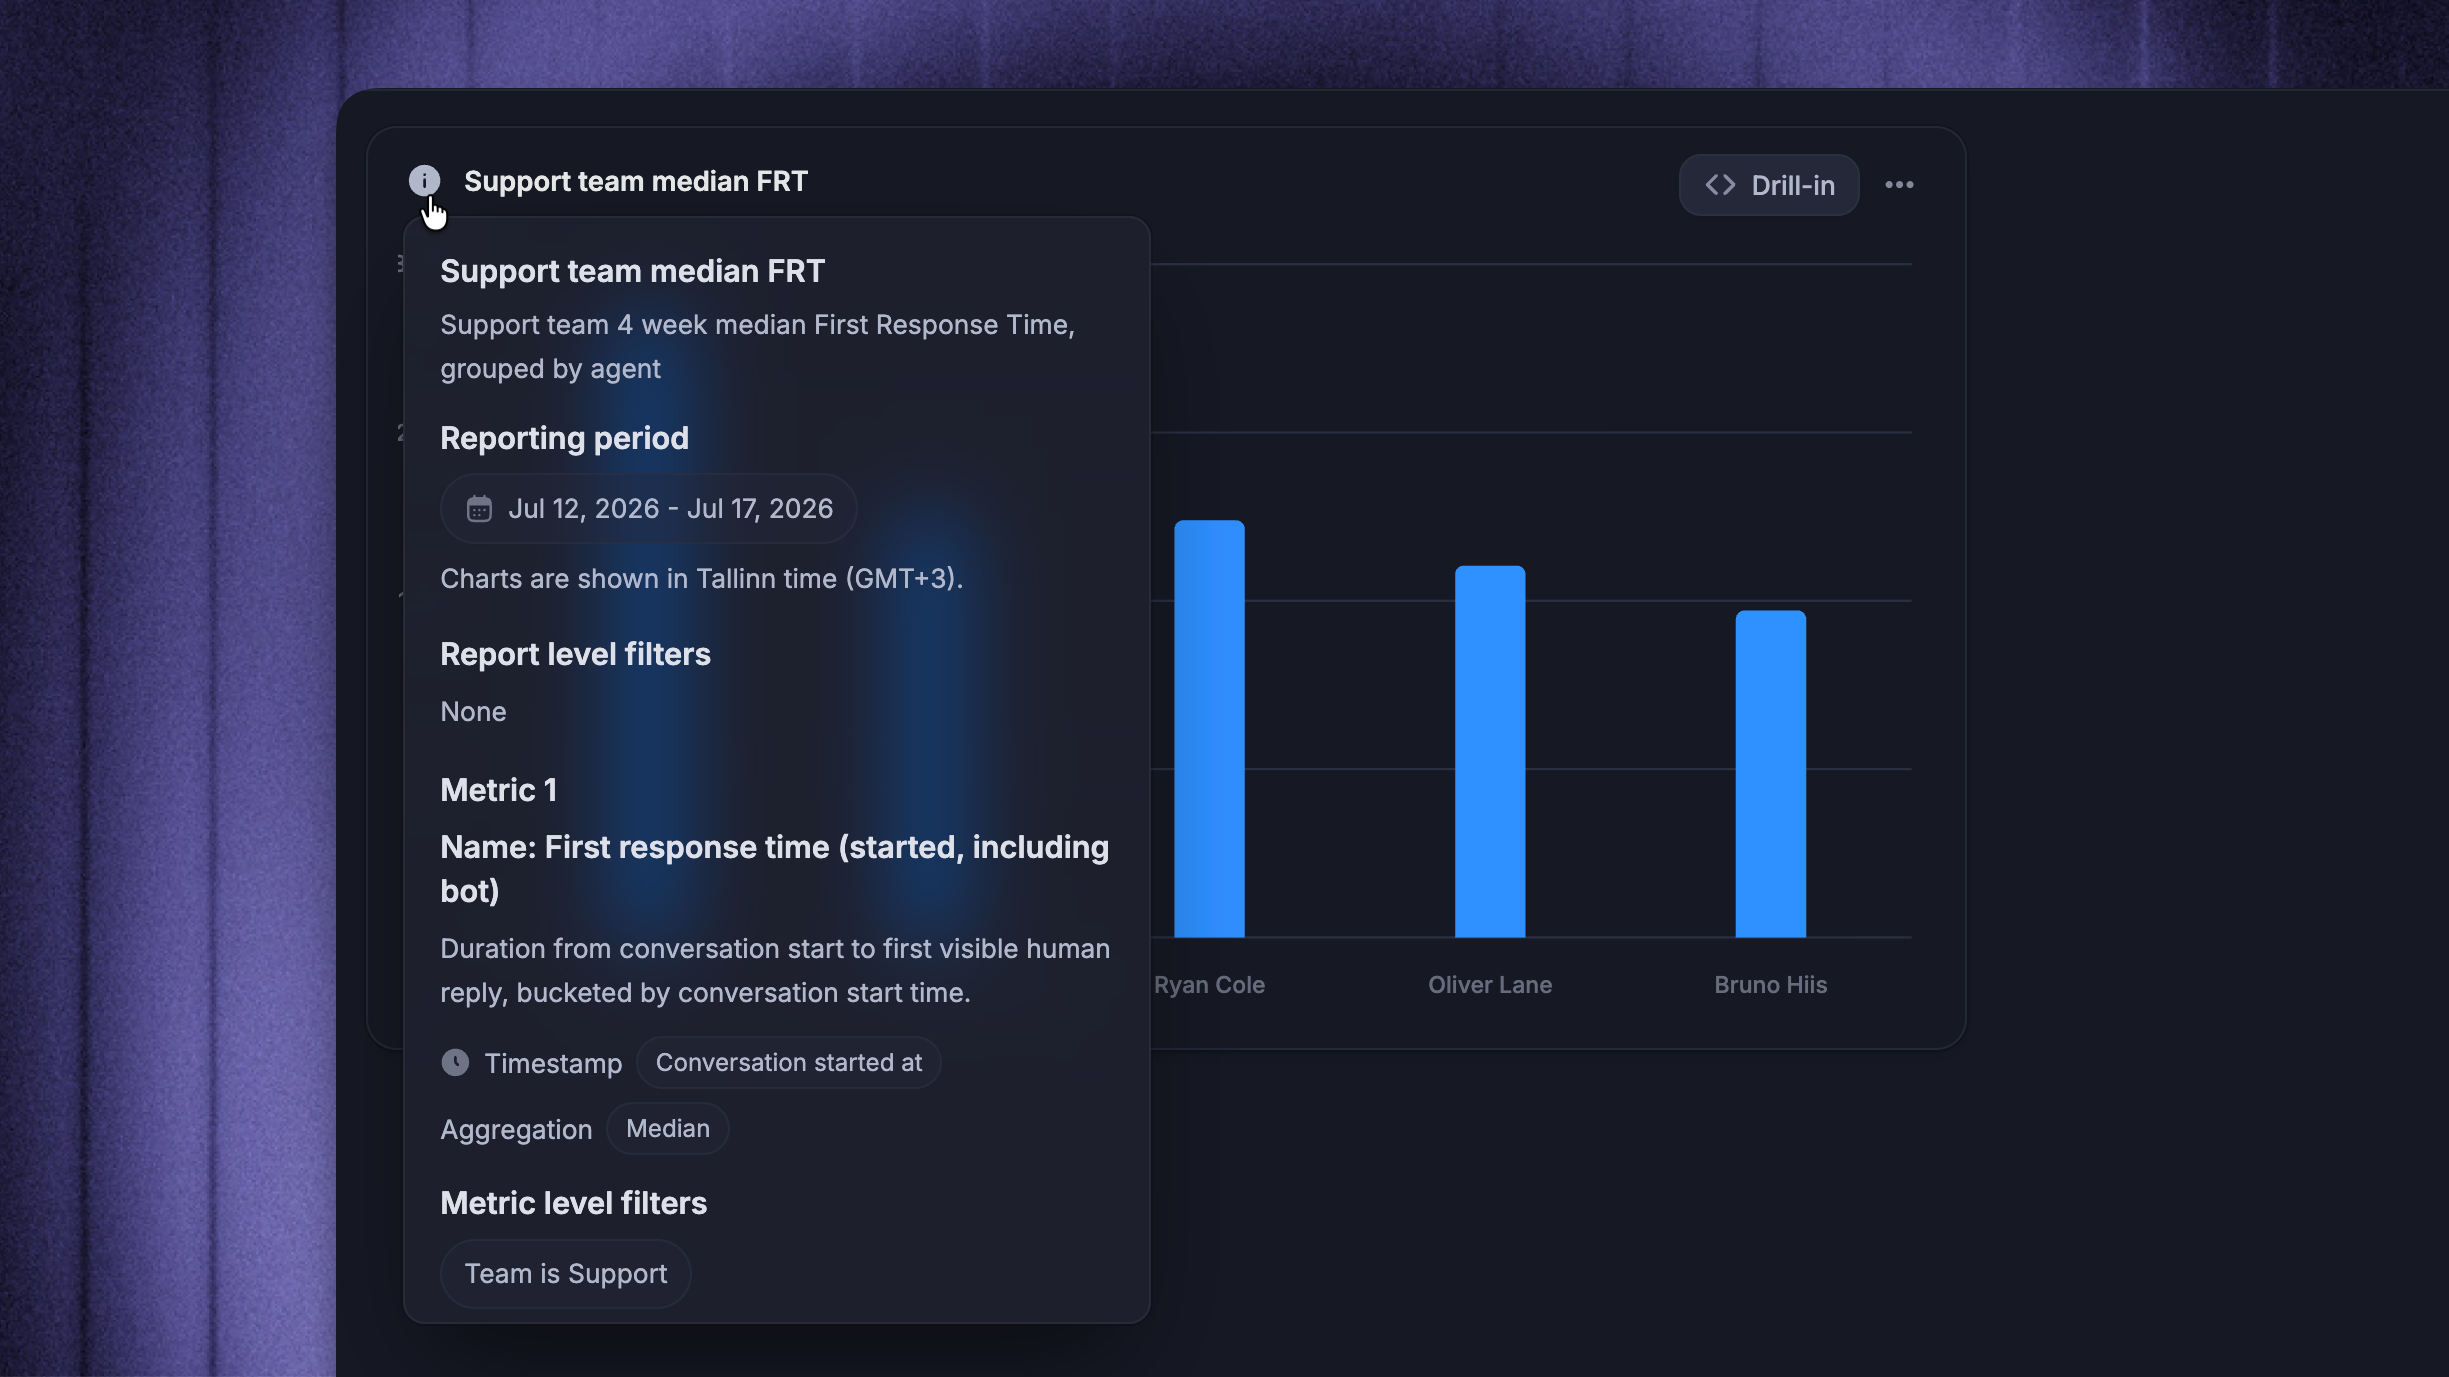
Hover a chart's information icon to see its metric definition, aggregation, timestamp basis, filters, and office-hours setting. The reporting metrics and attributes dictionary defines every metric and attribute available across Reports.
Take actions on charts
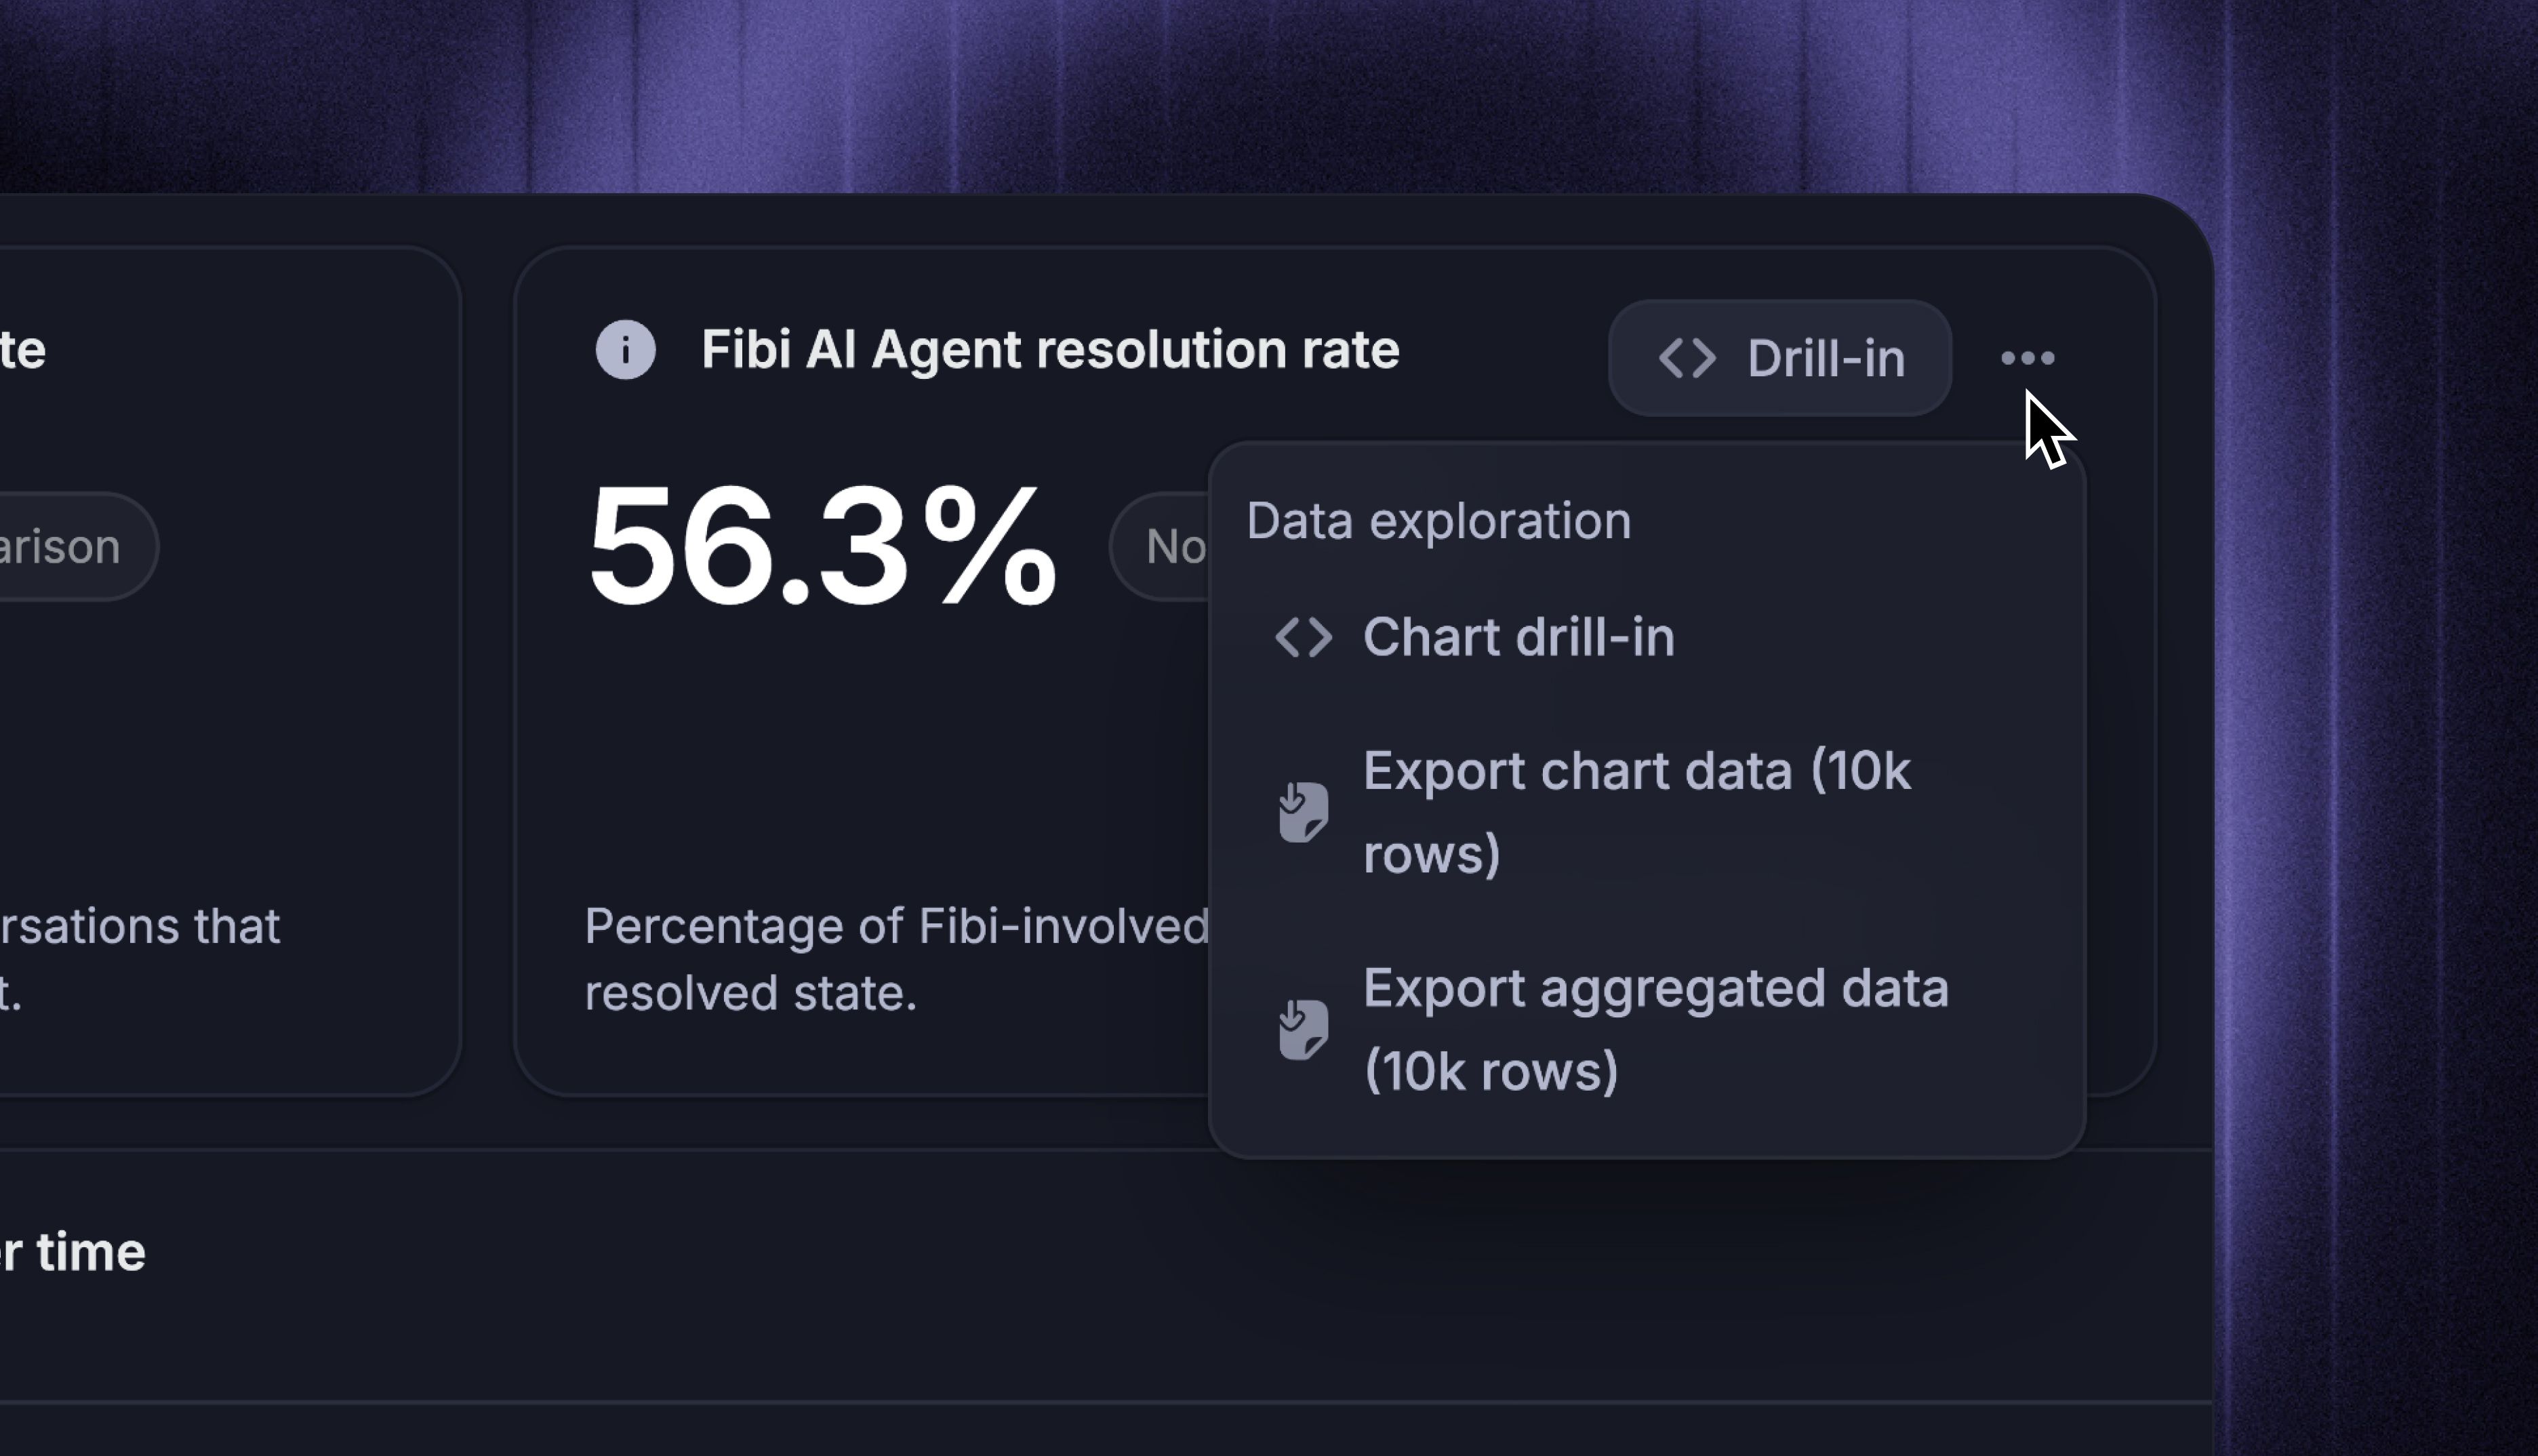
Hover a chart and click ••• three dots to open its actions:
Chart drill-in - inspect the rows behind the chart
Export chart data - download the raw rows behind the chart
Export aggregated data - download the calculated values shown in the chart
Edit chart - change its metrics, filters, breakdowns, and display options
Duplicate - create a copy in the same report
Remove - delete the chart from the report
Note: Editing actions appear when you edit a custom report. Drill-in and exports follow your Reports permissions.
Drill into any number
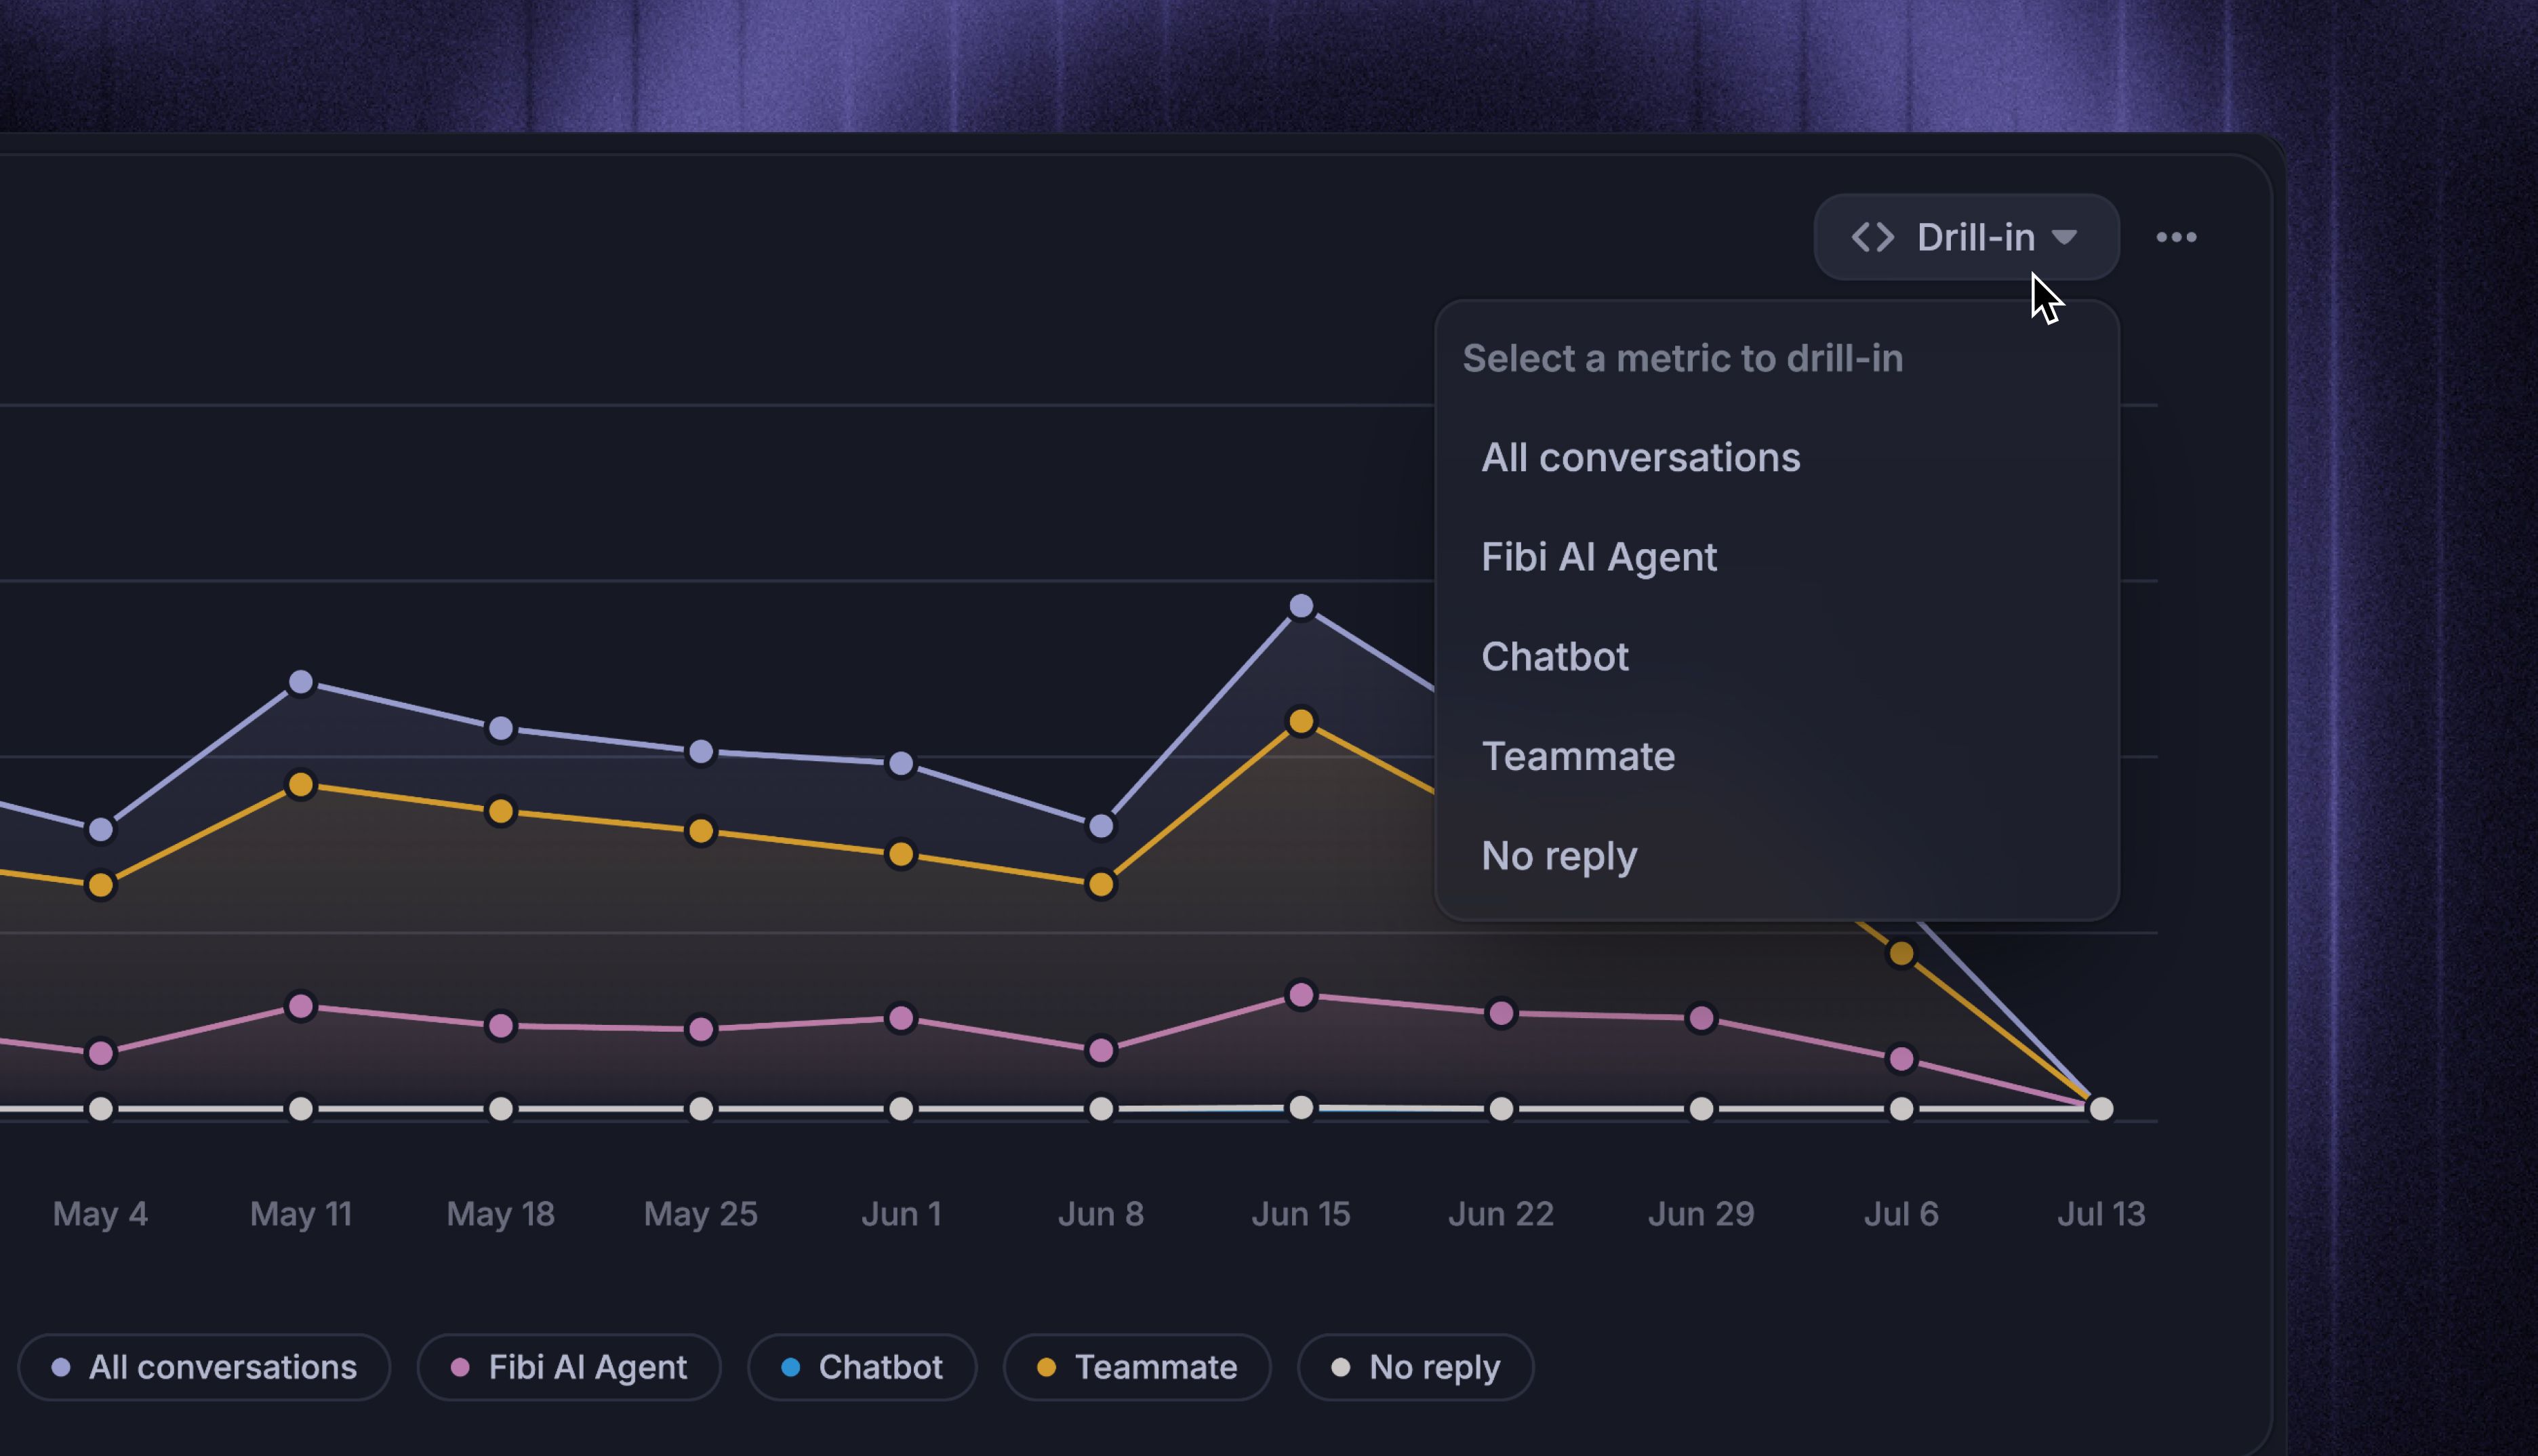
Drill-in opens the rows behind a chart so you can investigate what drove a result. Open it from a chart action or select a bar, point, or table row, then filter, sort, preview, or export the underlying data.
Filter reports
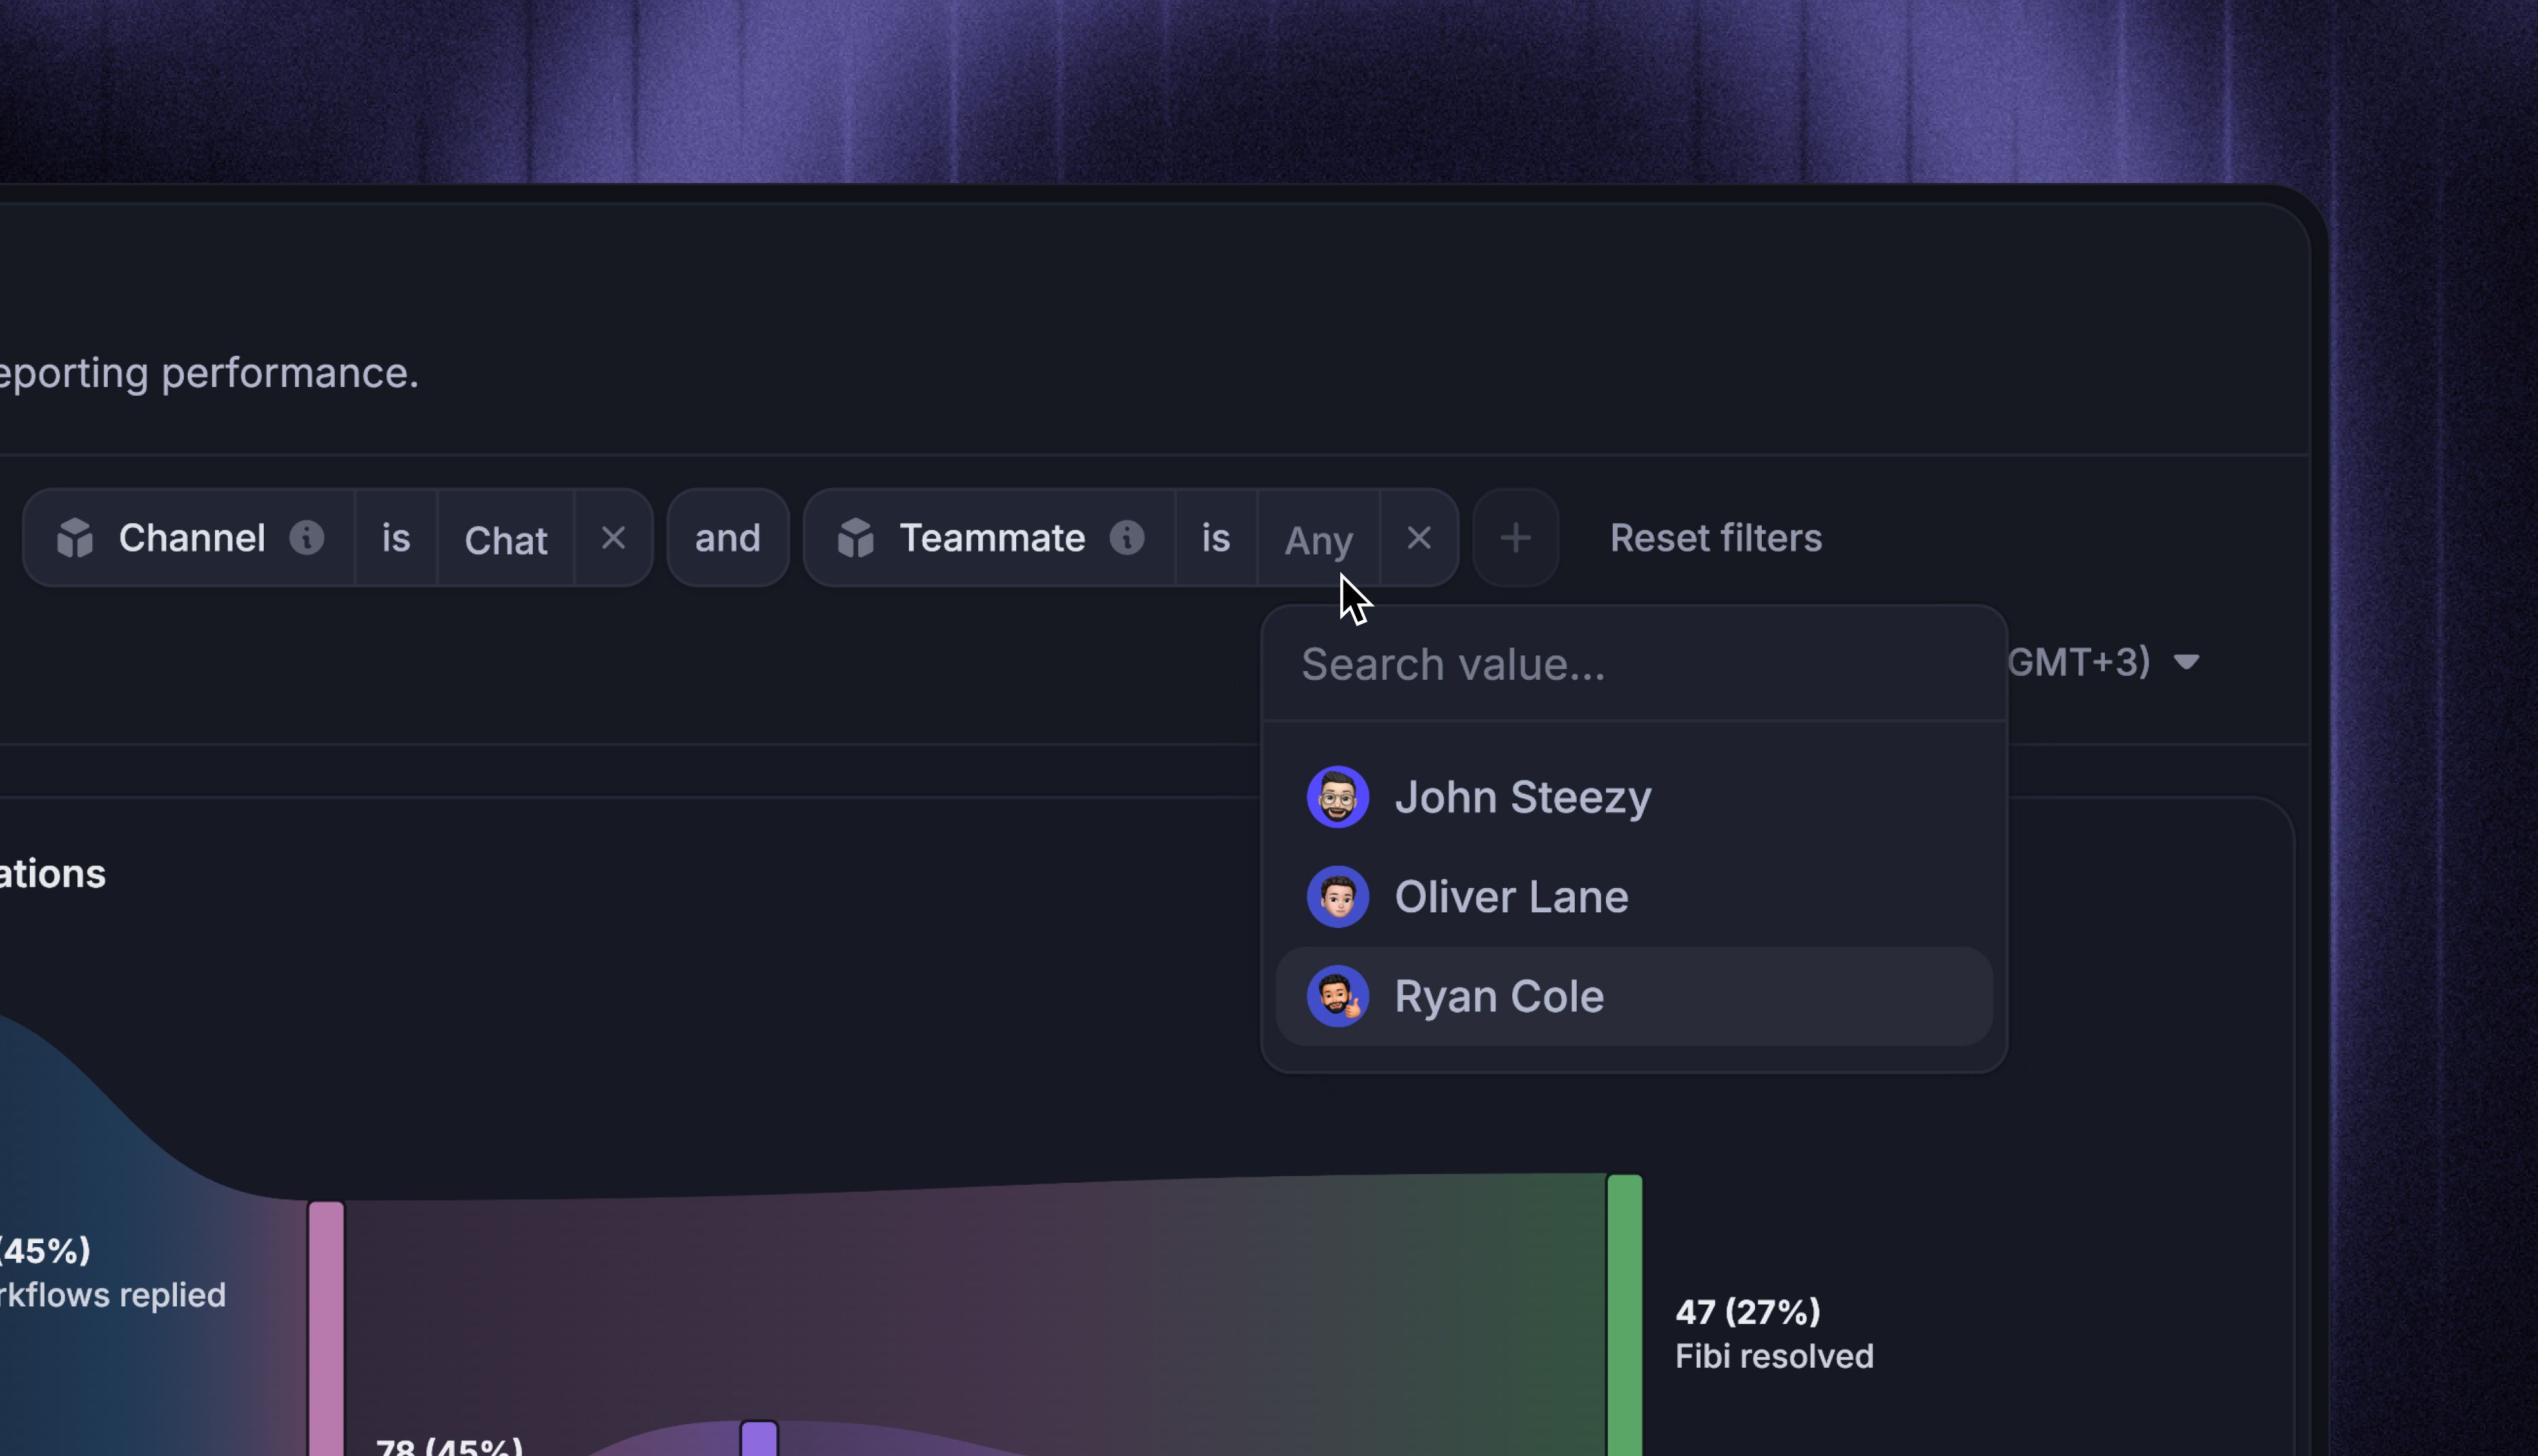
Use Add filter in the report header to narrow every chart, or apply chart-level filters to compare different populations in the same report. The header's date range and timezone also apply across the report.
Note: In saved reports, teammates with ‘Explore' access can make temporary changes without altering the saved version.
Share reports
Access controls enable you to control who can view and edit your reports, protecting sensitive data and ensuring that only the right teammates have access to specific reports, for both security and collaboration.
Control access
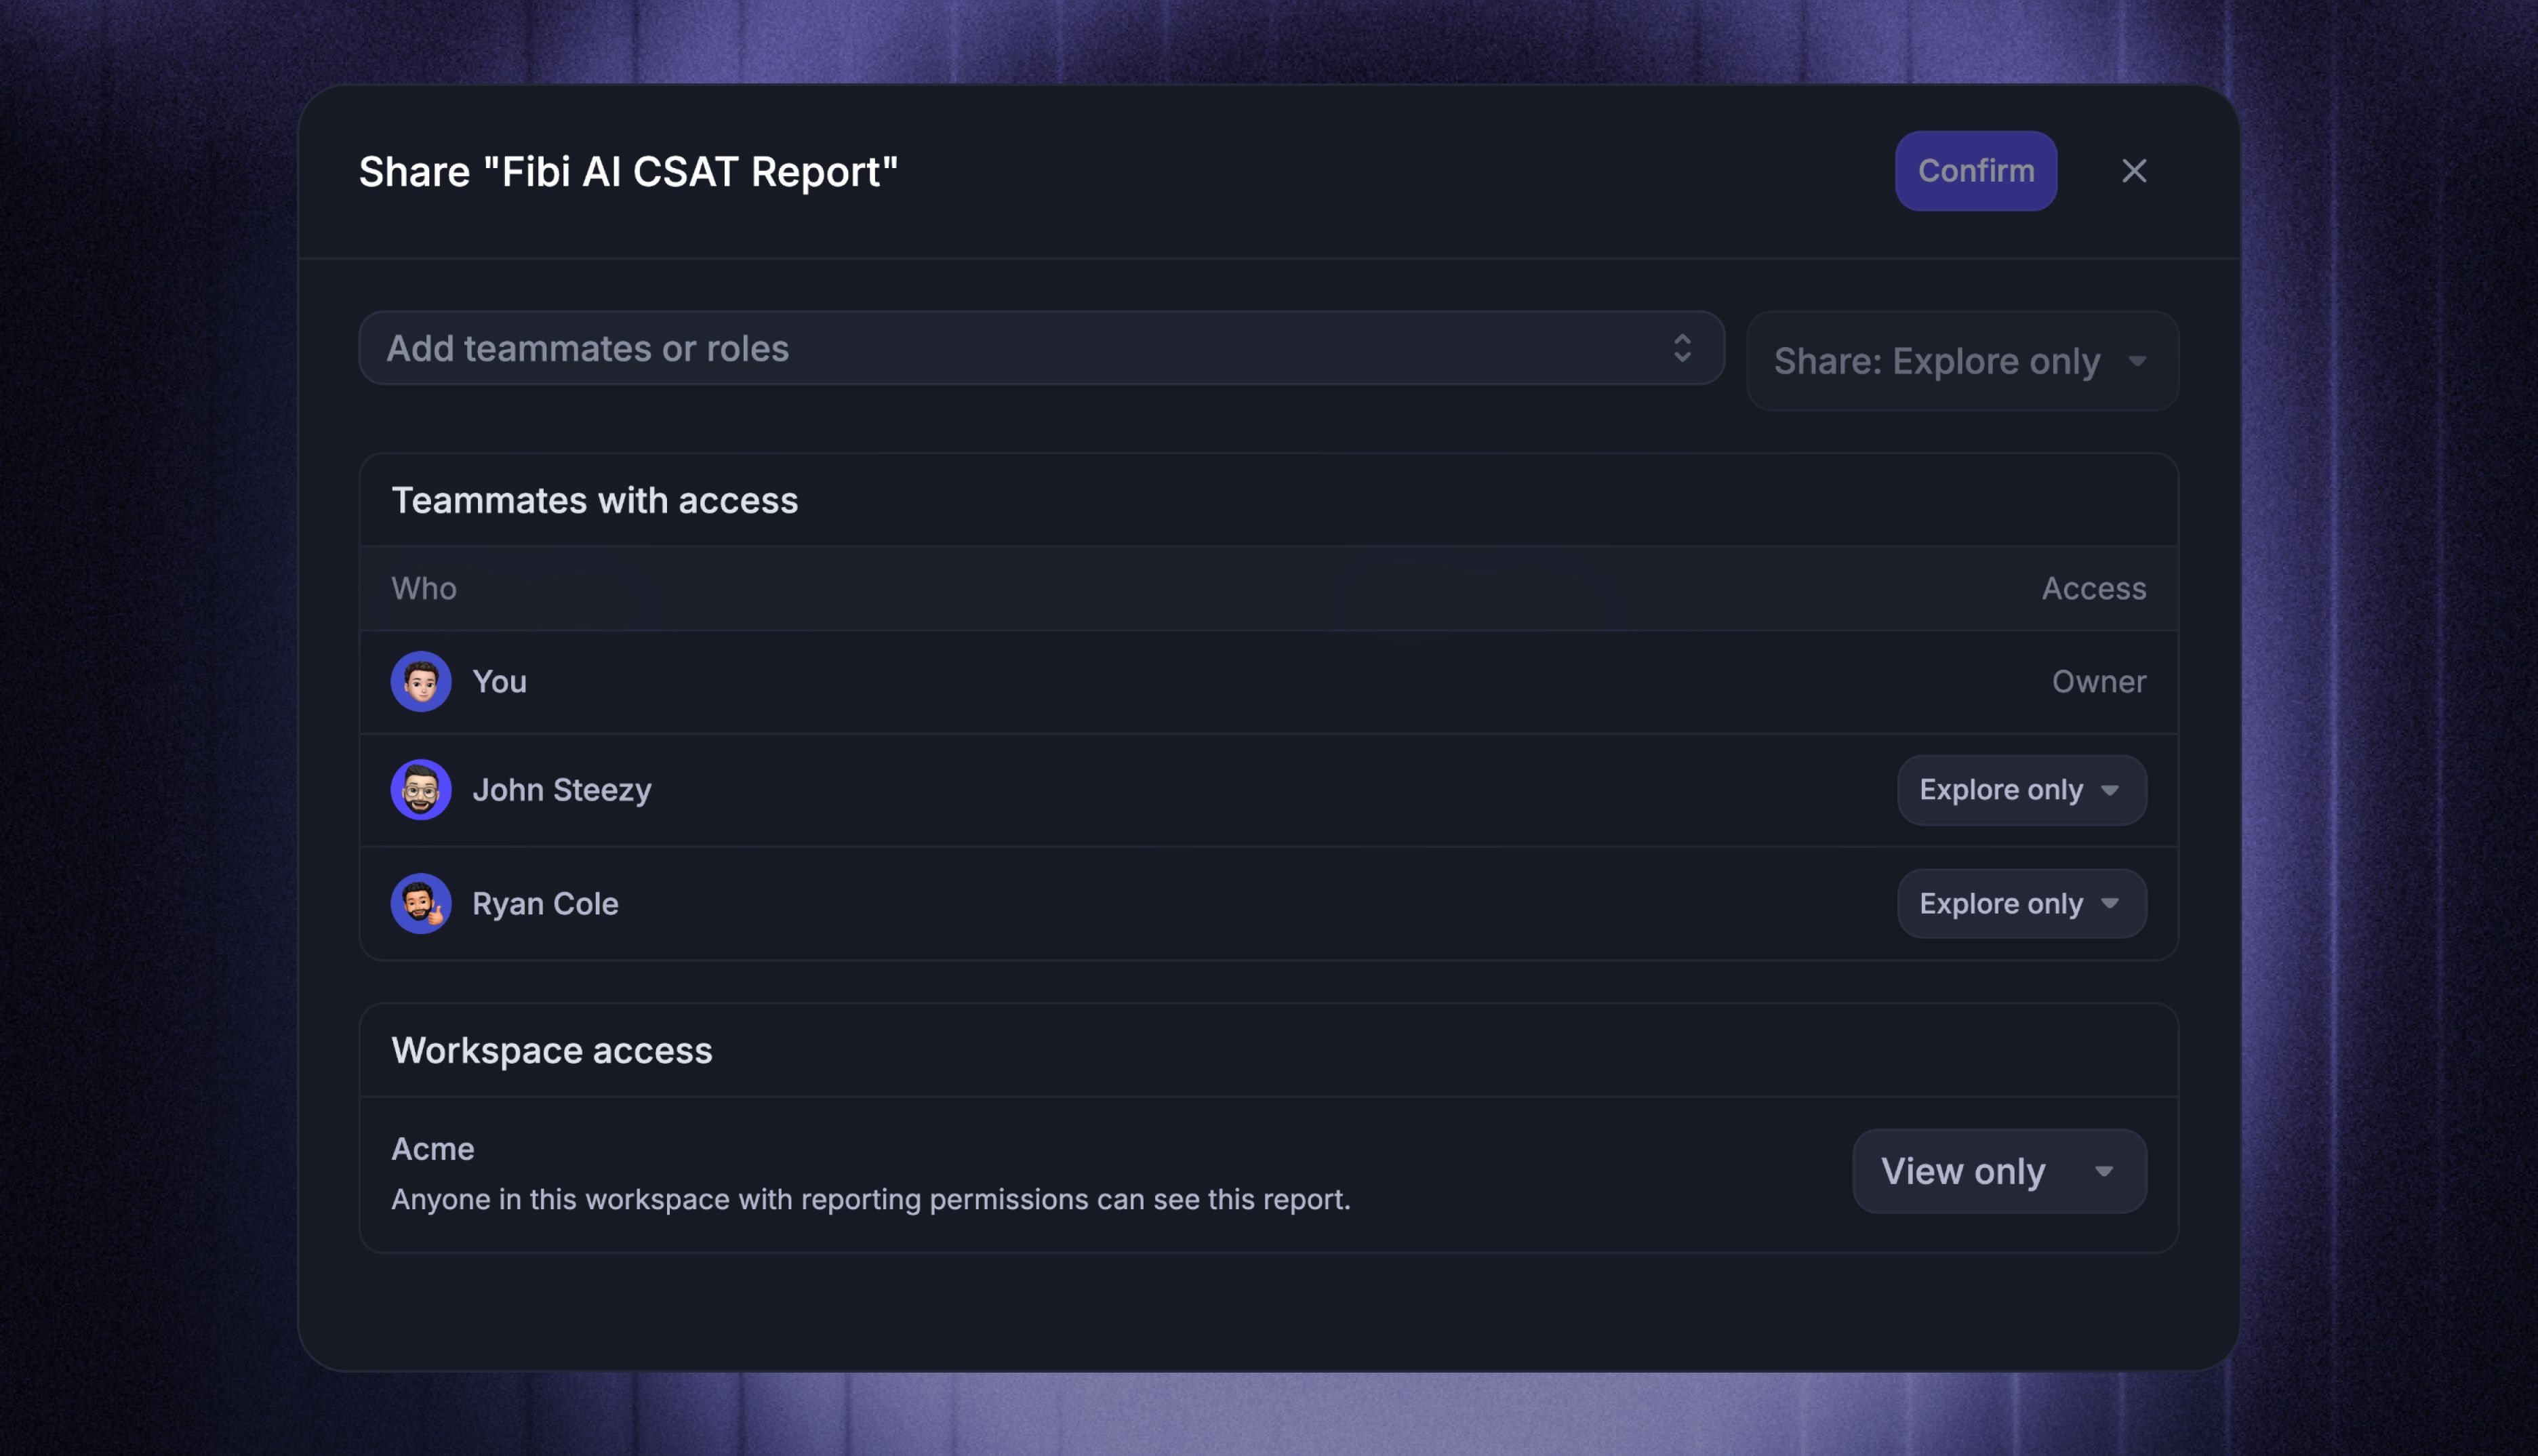
Saved reports are private by default. Share a report with specific teammates, roles, or your whole workspace and choose whether they can edit it, explore the data, or only view the saved result.
Share externally
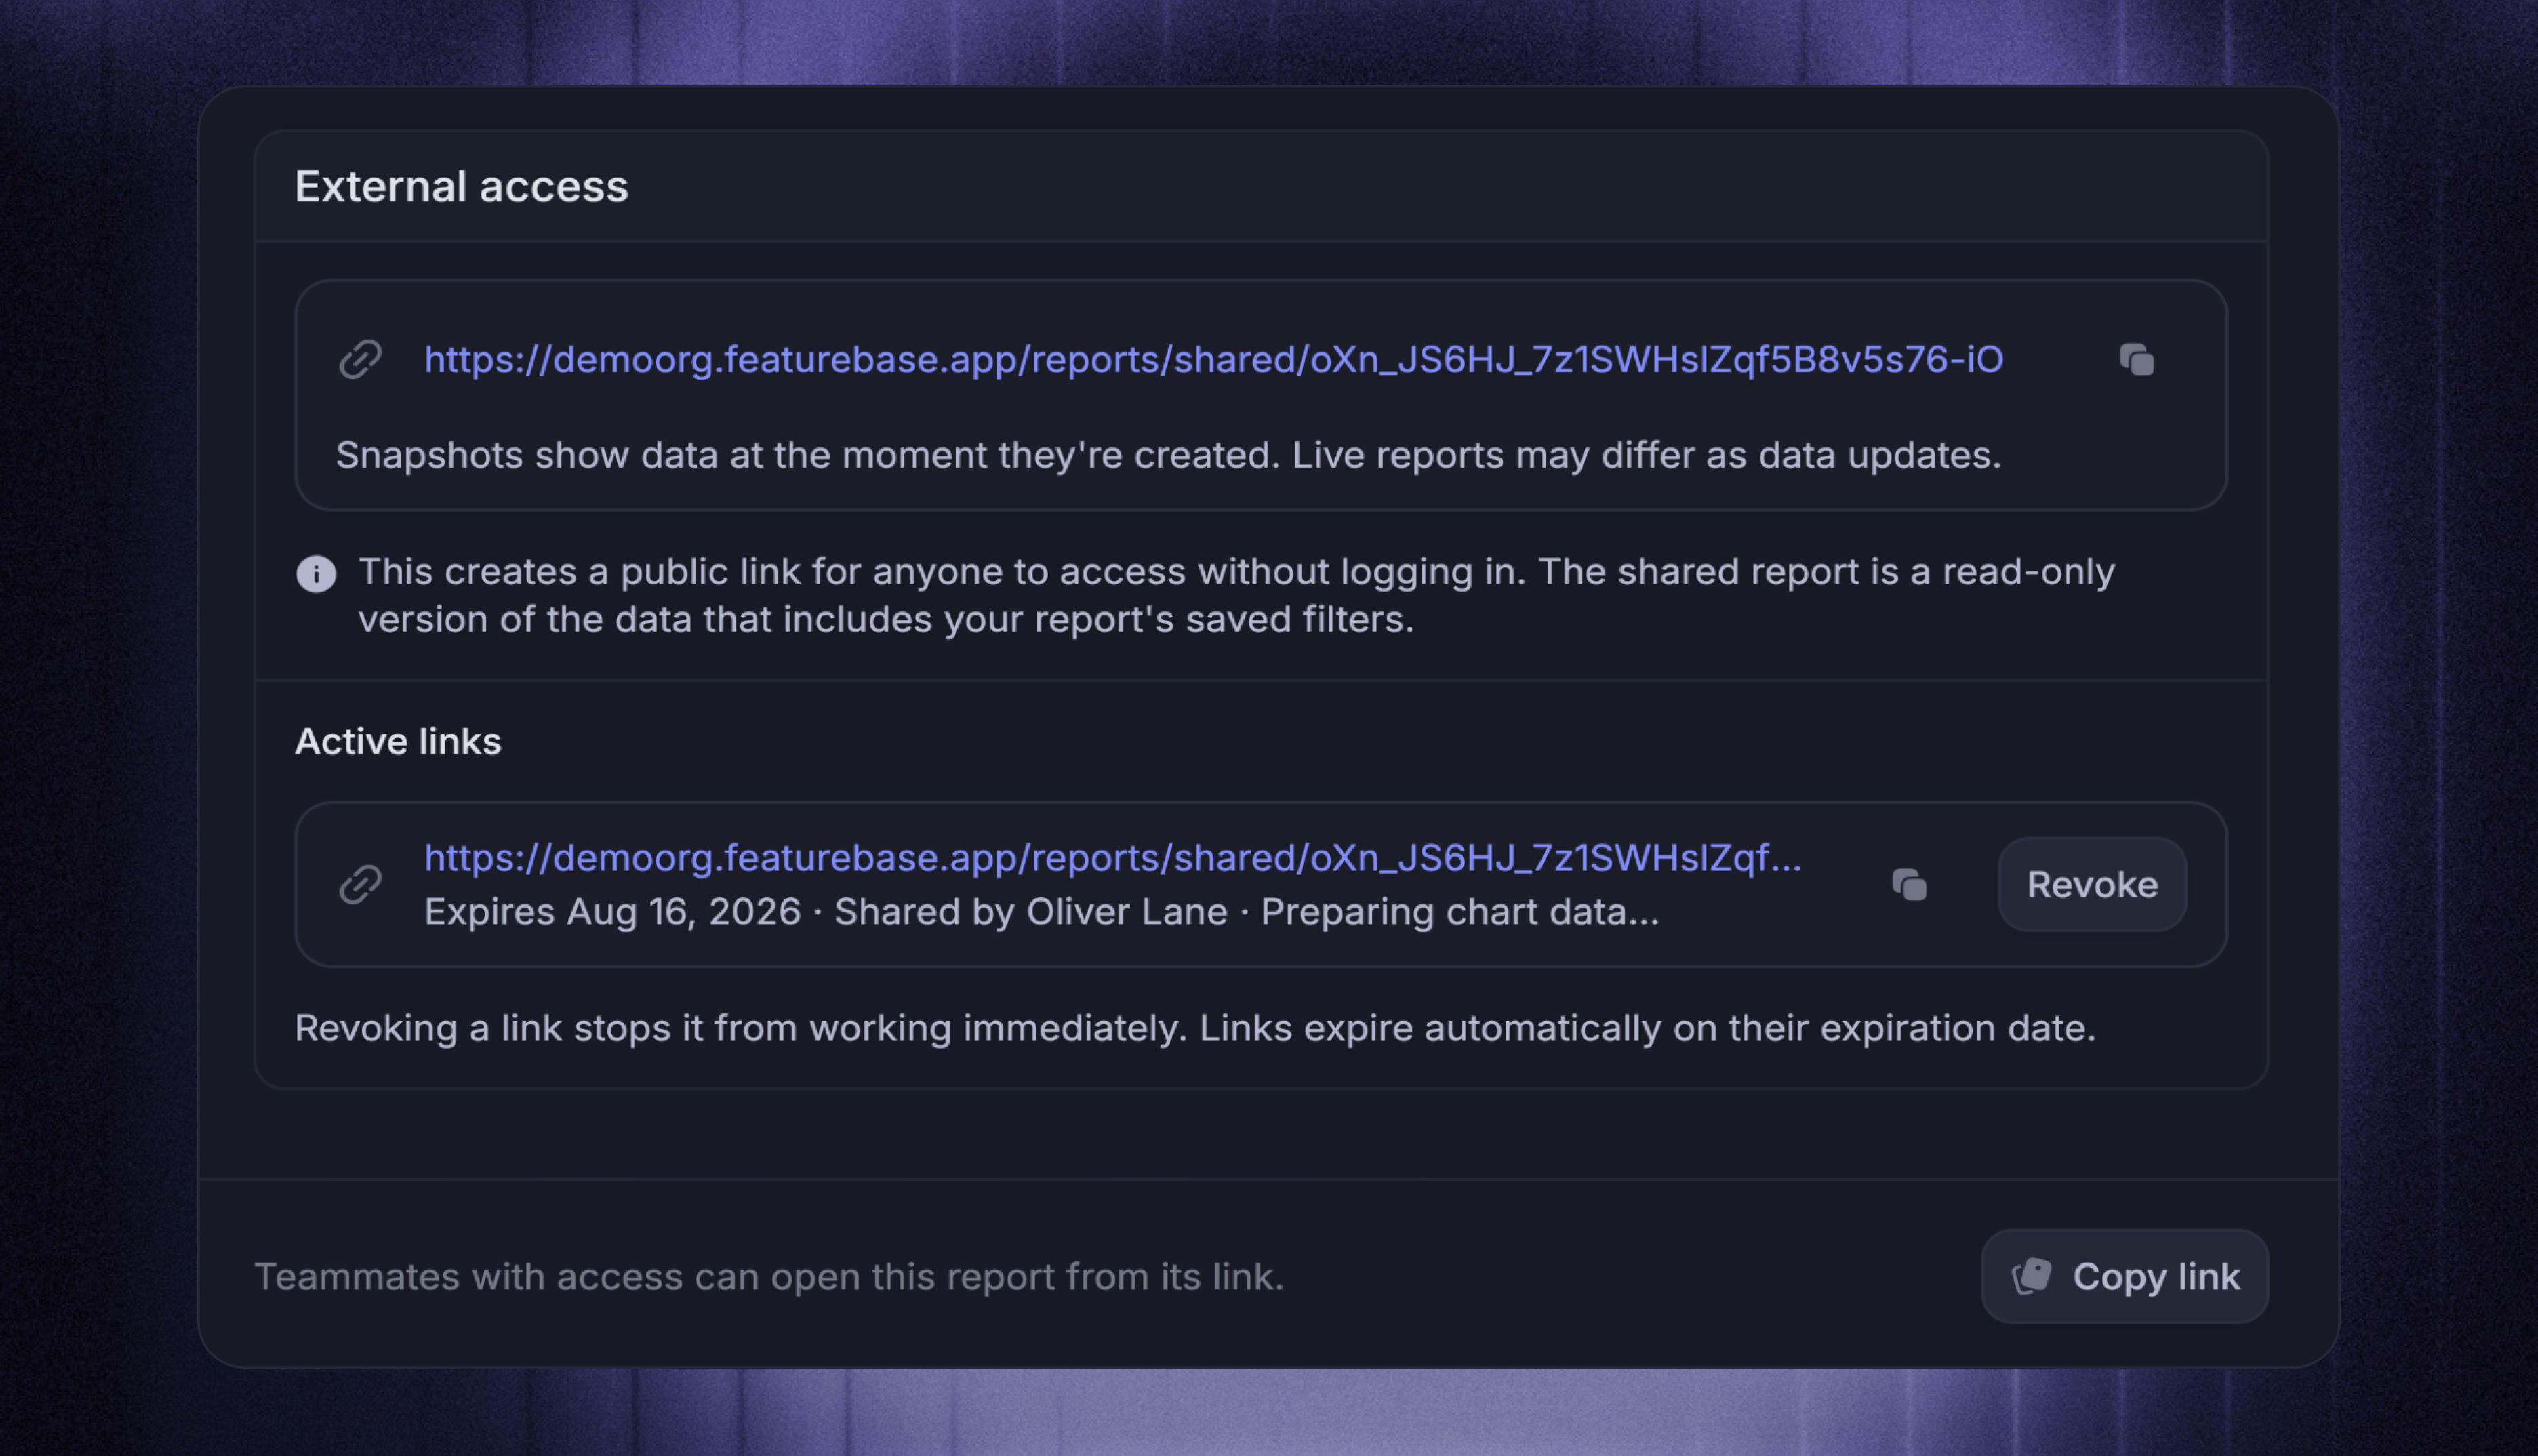
For people outside your workspace, create a public read-only snapshot. This gives recipients a fixed view of the report without granting access to your workspace or its underlying data.
Schedule reports
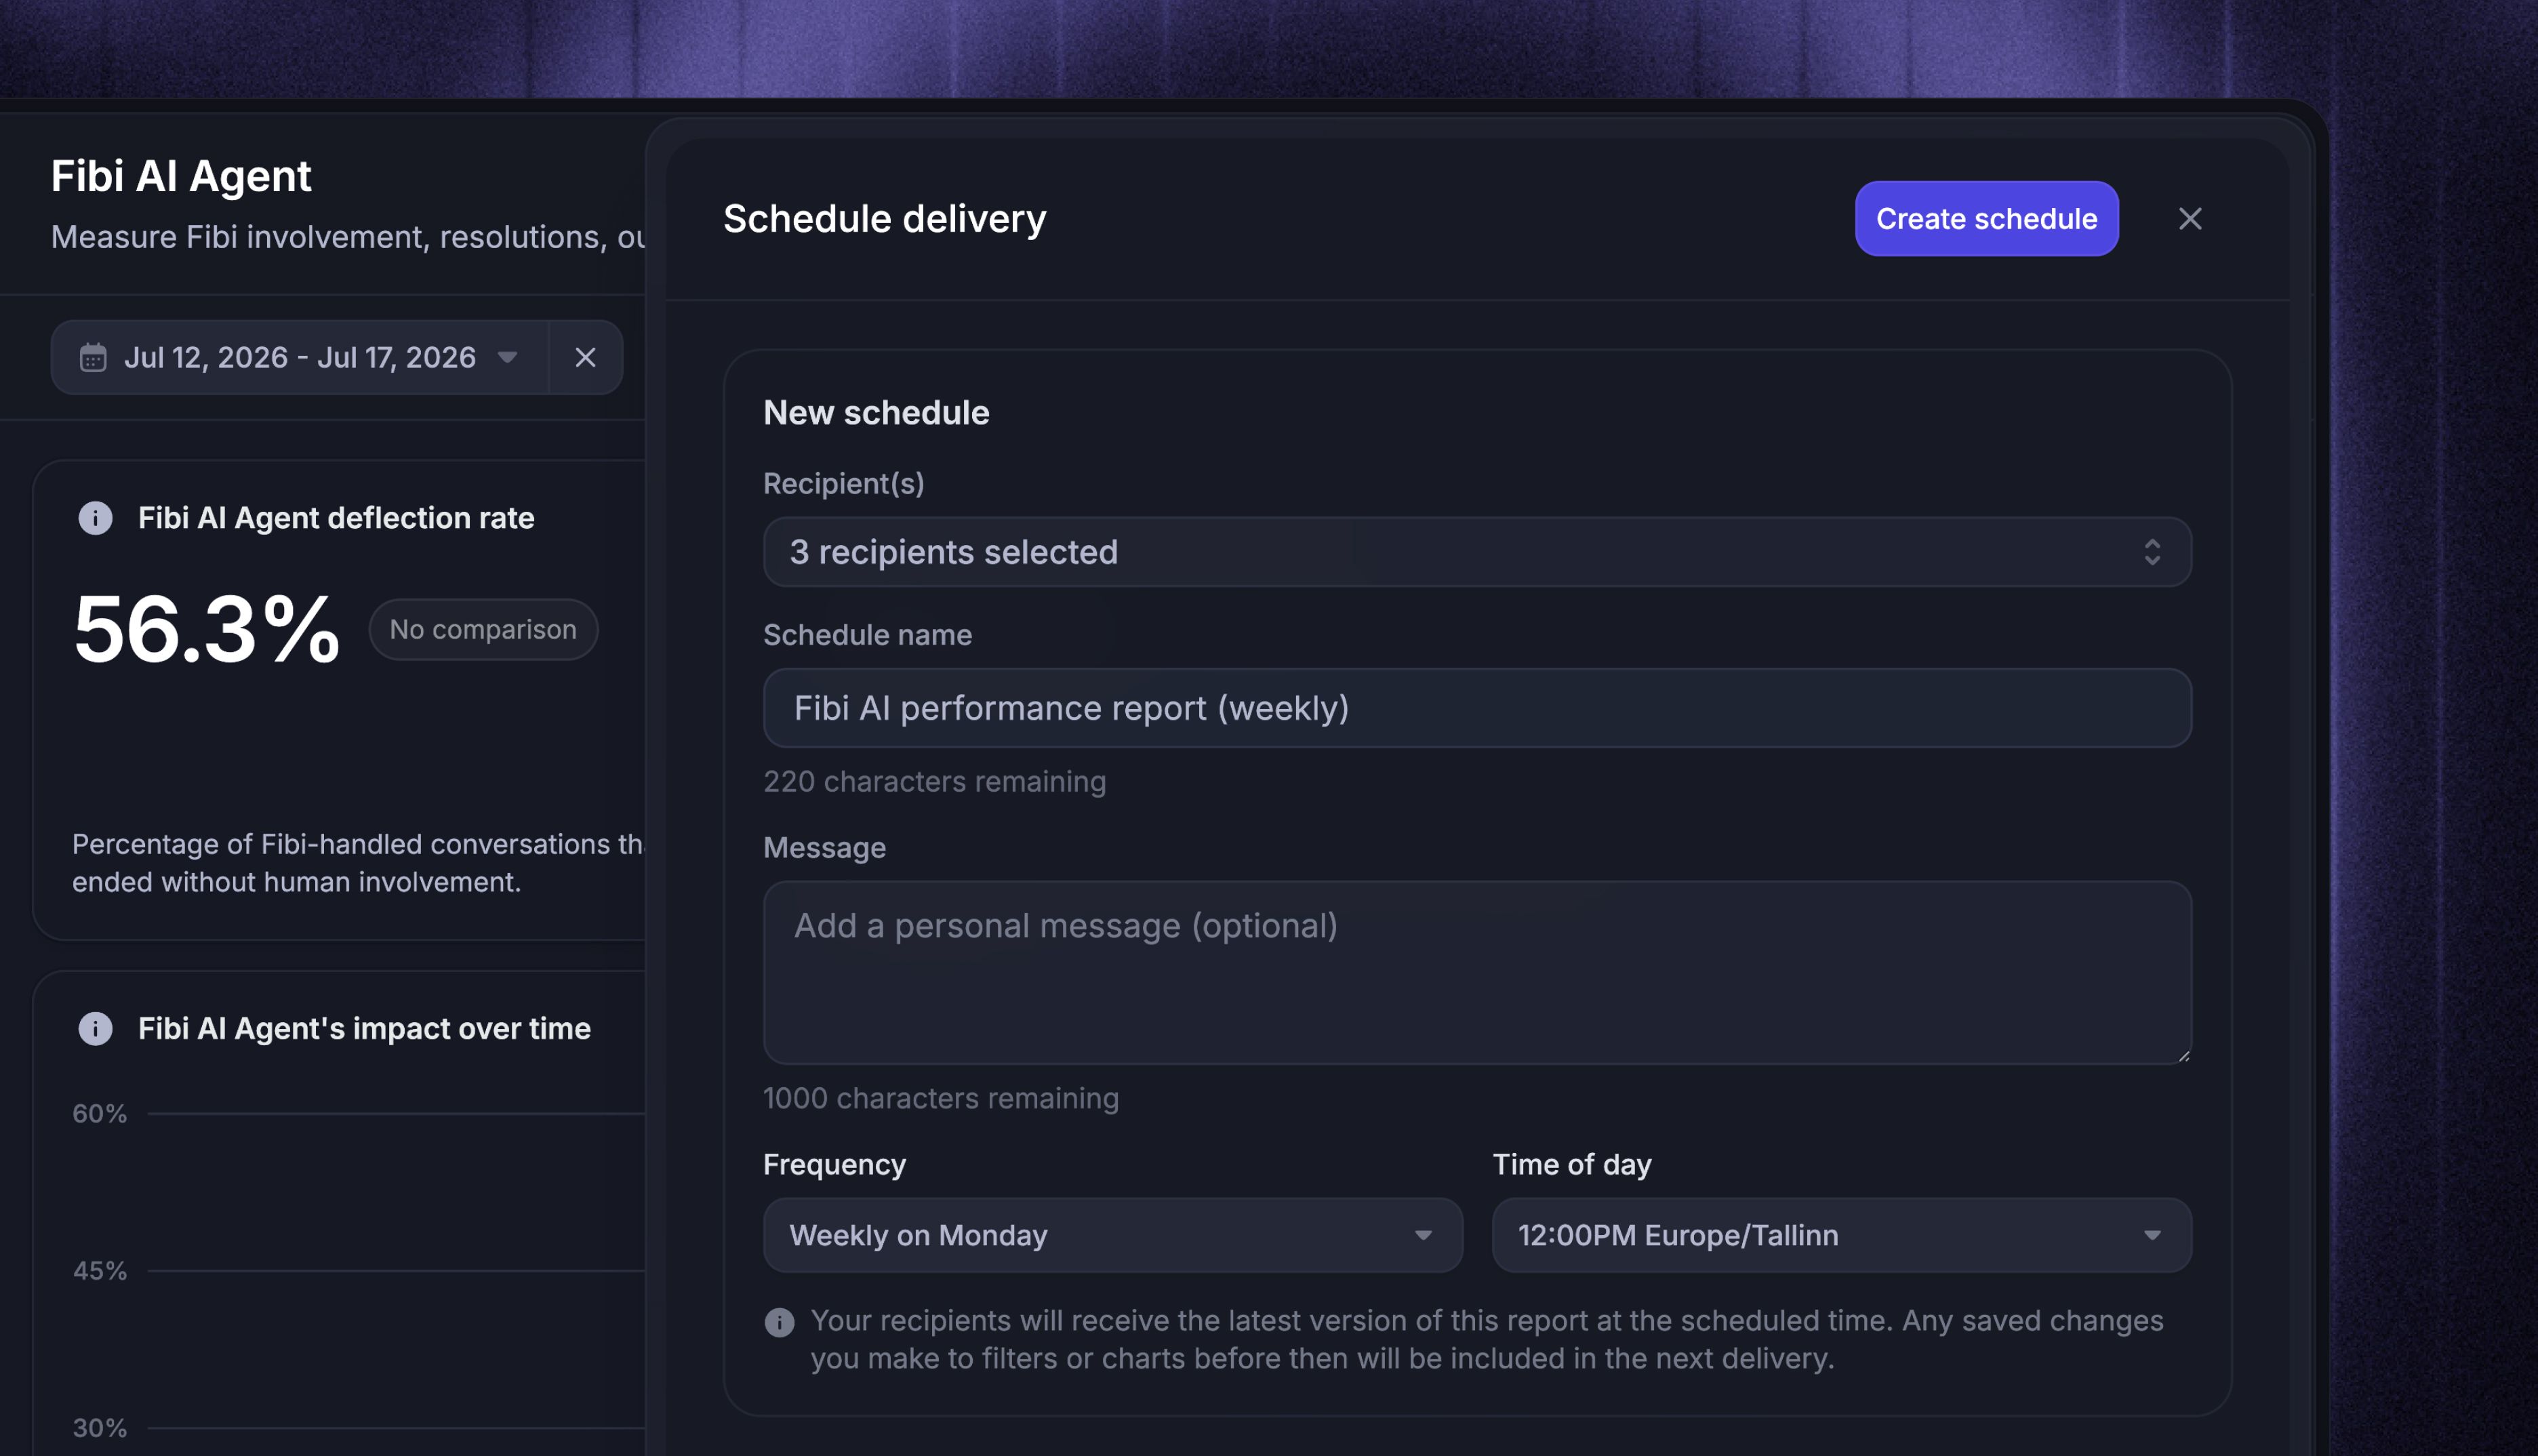
Use scheduled report delivery to send fresh read-only snapshots by email to teammates, roles, or external recipients. This works well for a private report used in a manager's 1:1 or a weekly summary sent to leadership.
Organize reports
Reports you own appear under Your reports, while reports teammates share with you appear under Shared with you.
Create folders
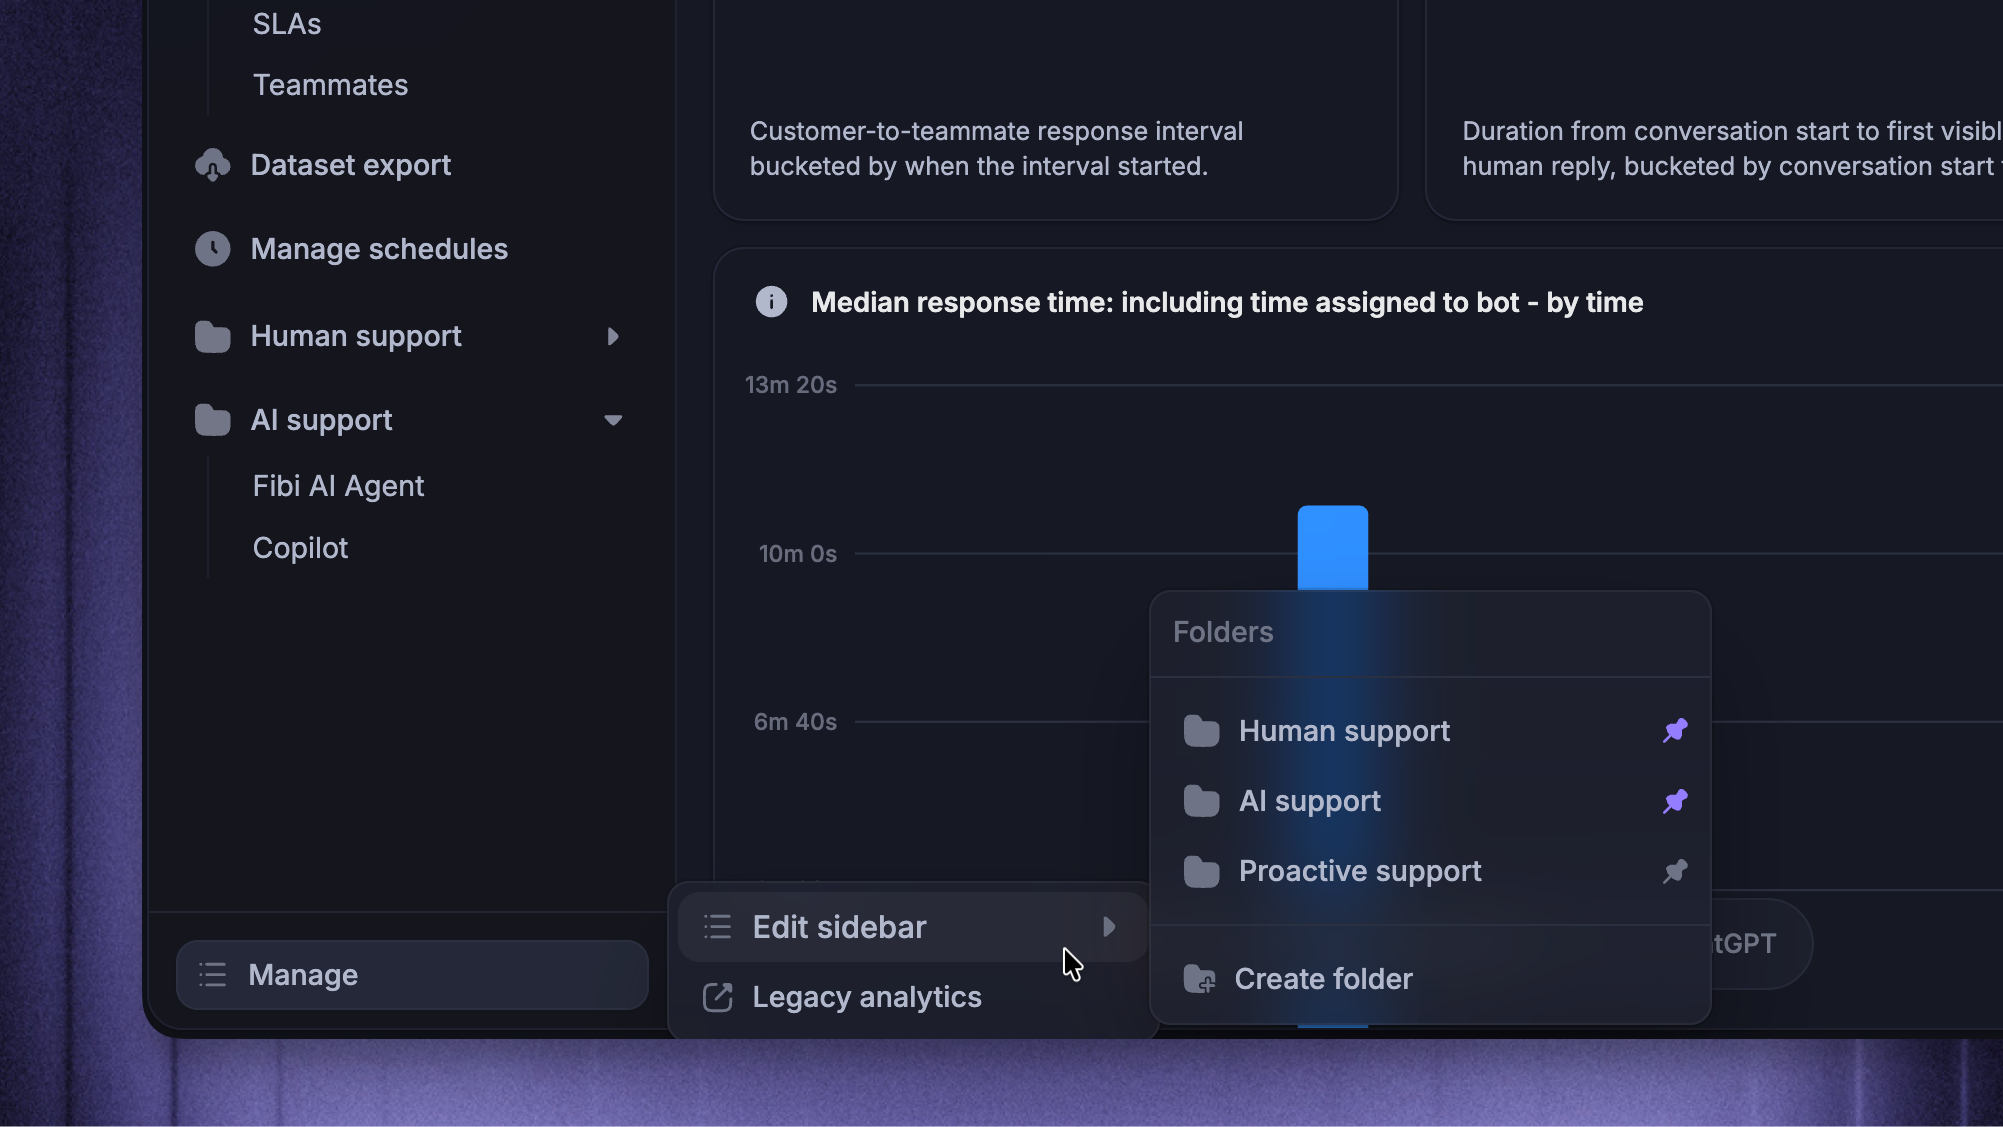
Click Manage → Edit sidebar → Create folder
Enter a name and click Create folder
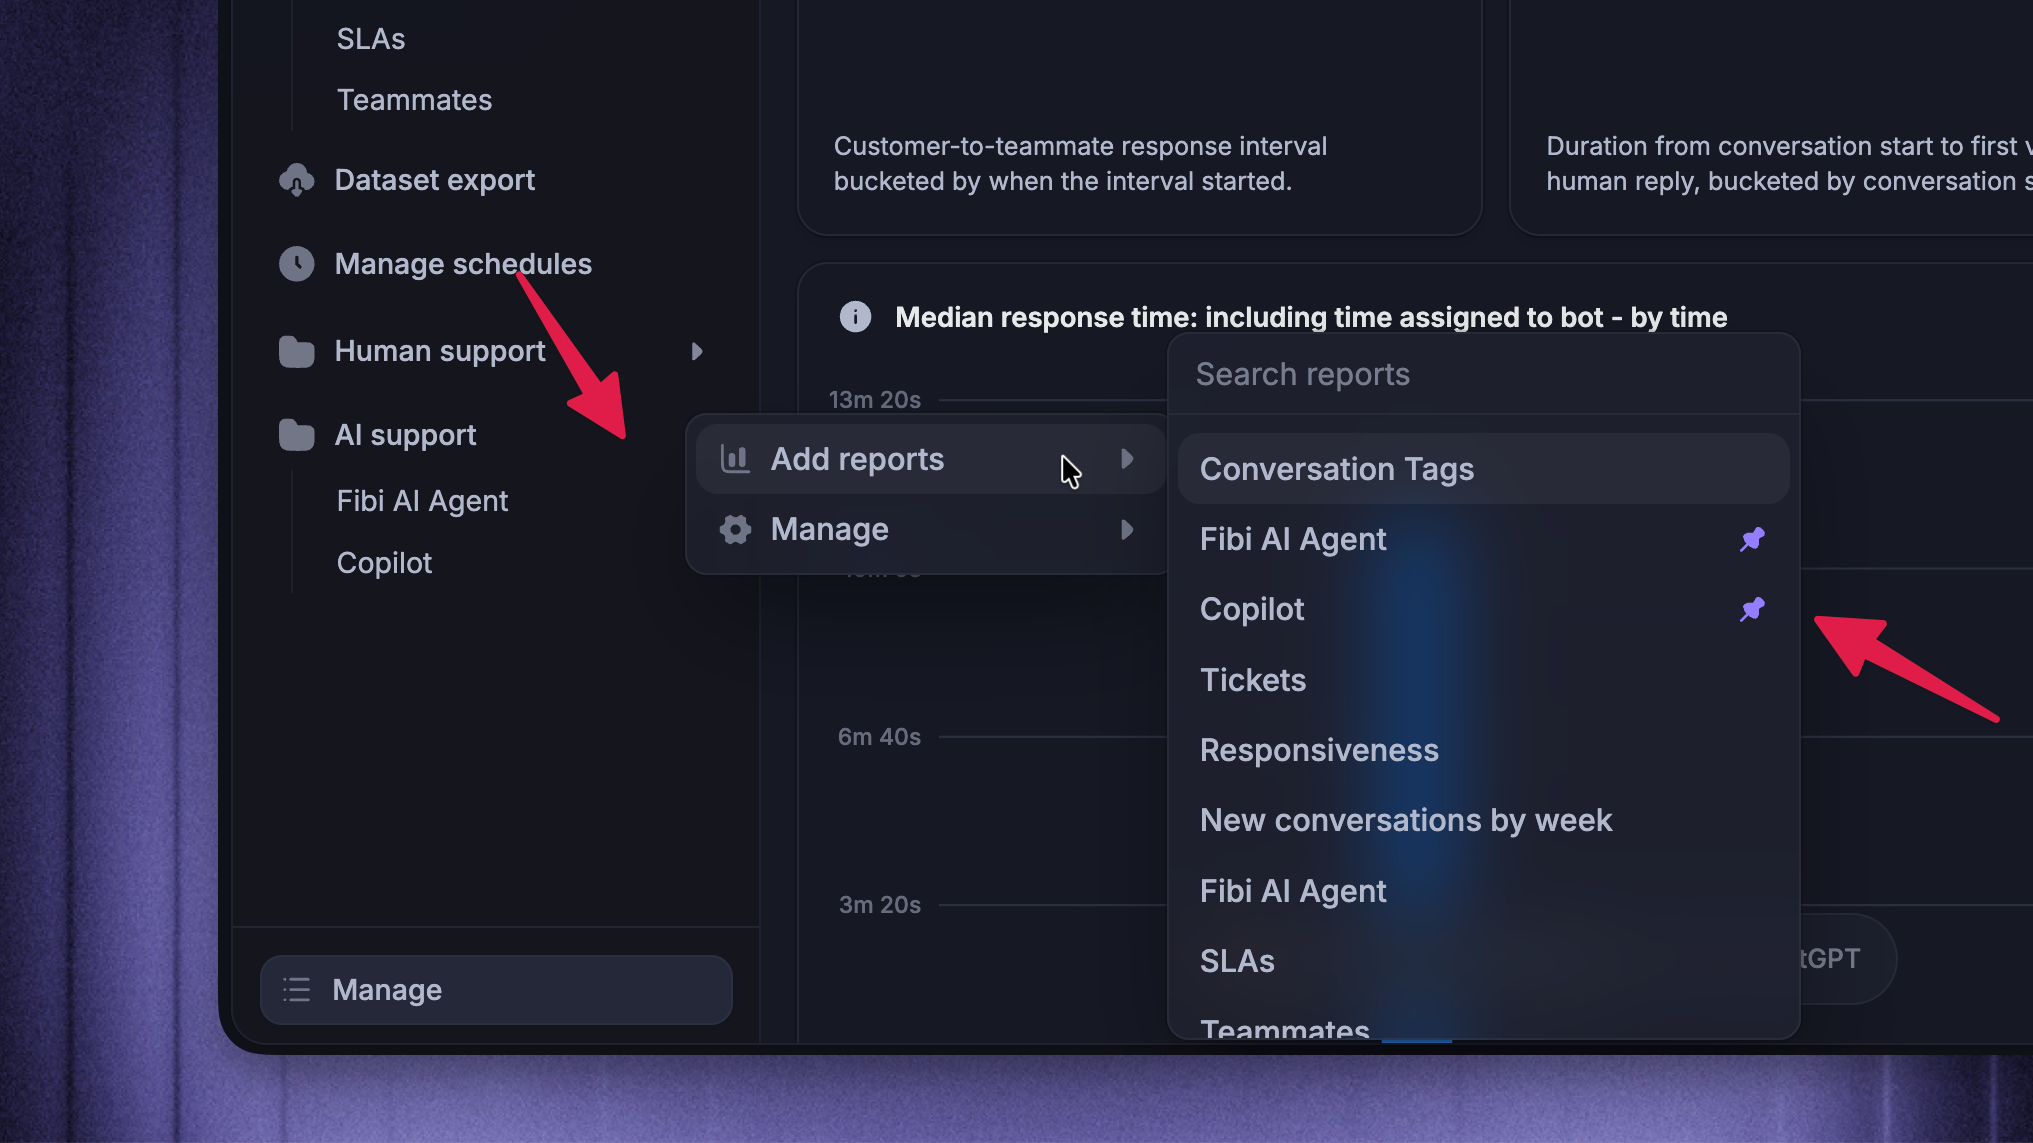
Open the folder's More actions → Add reports menu
Add the saved reports or built-in templates you want
Folders are shared with your workspace, but the reports inside keep their own access settings.
Favorite reports
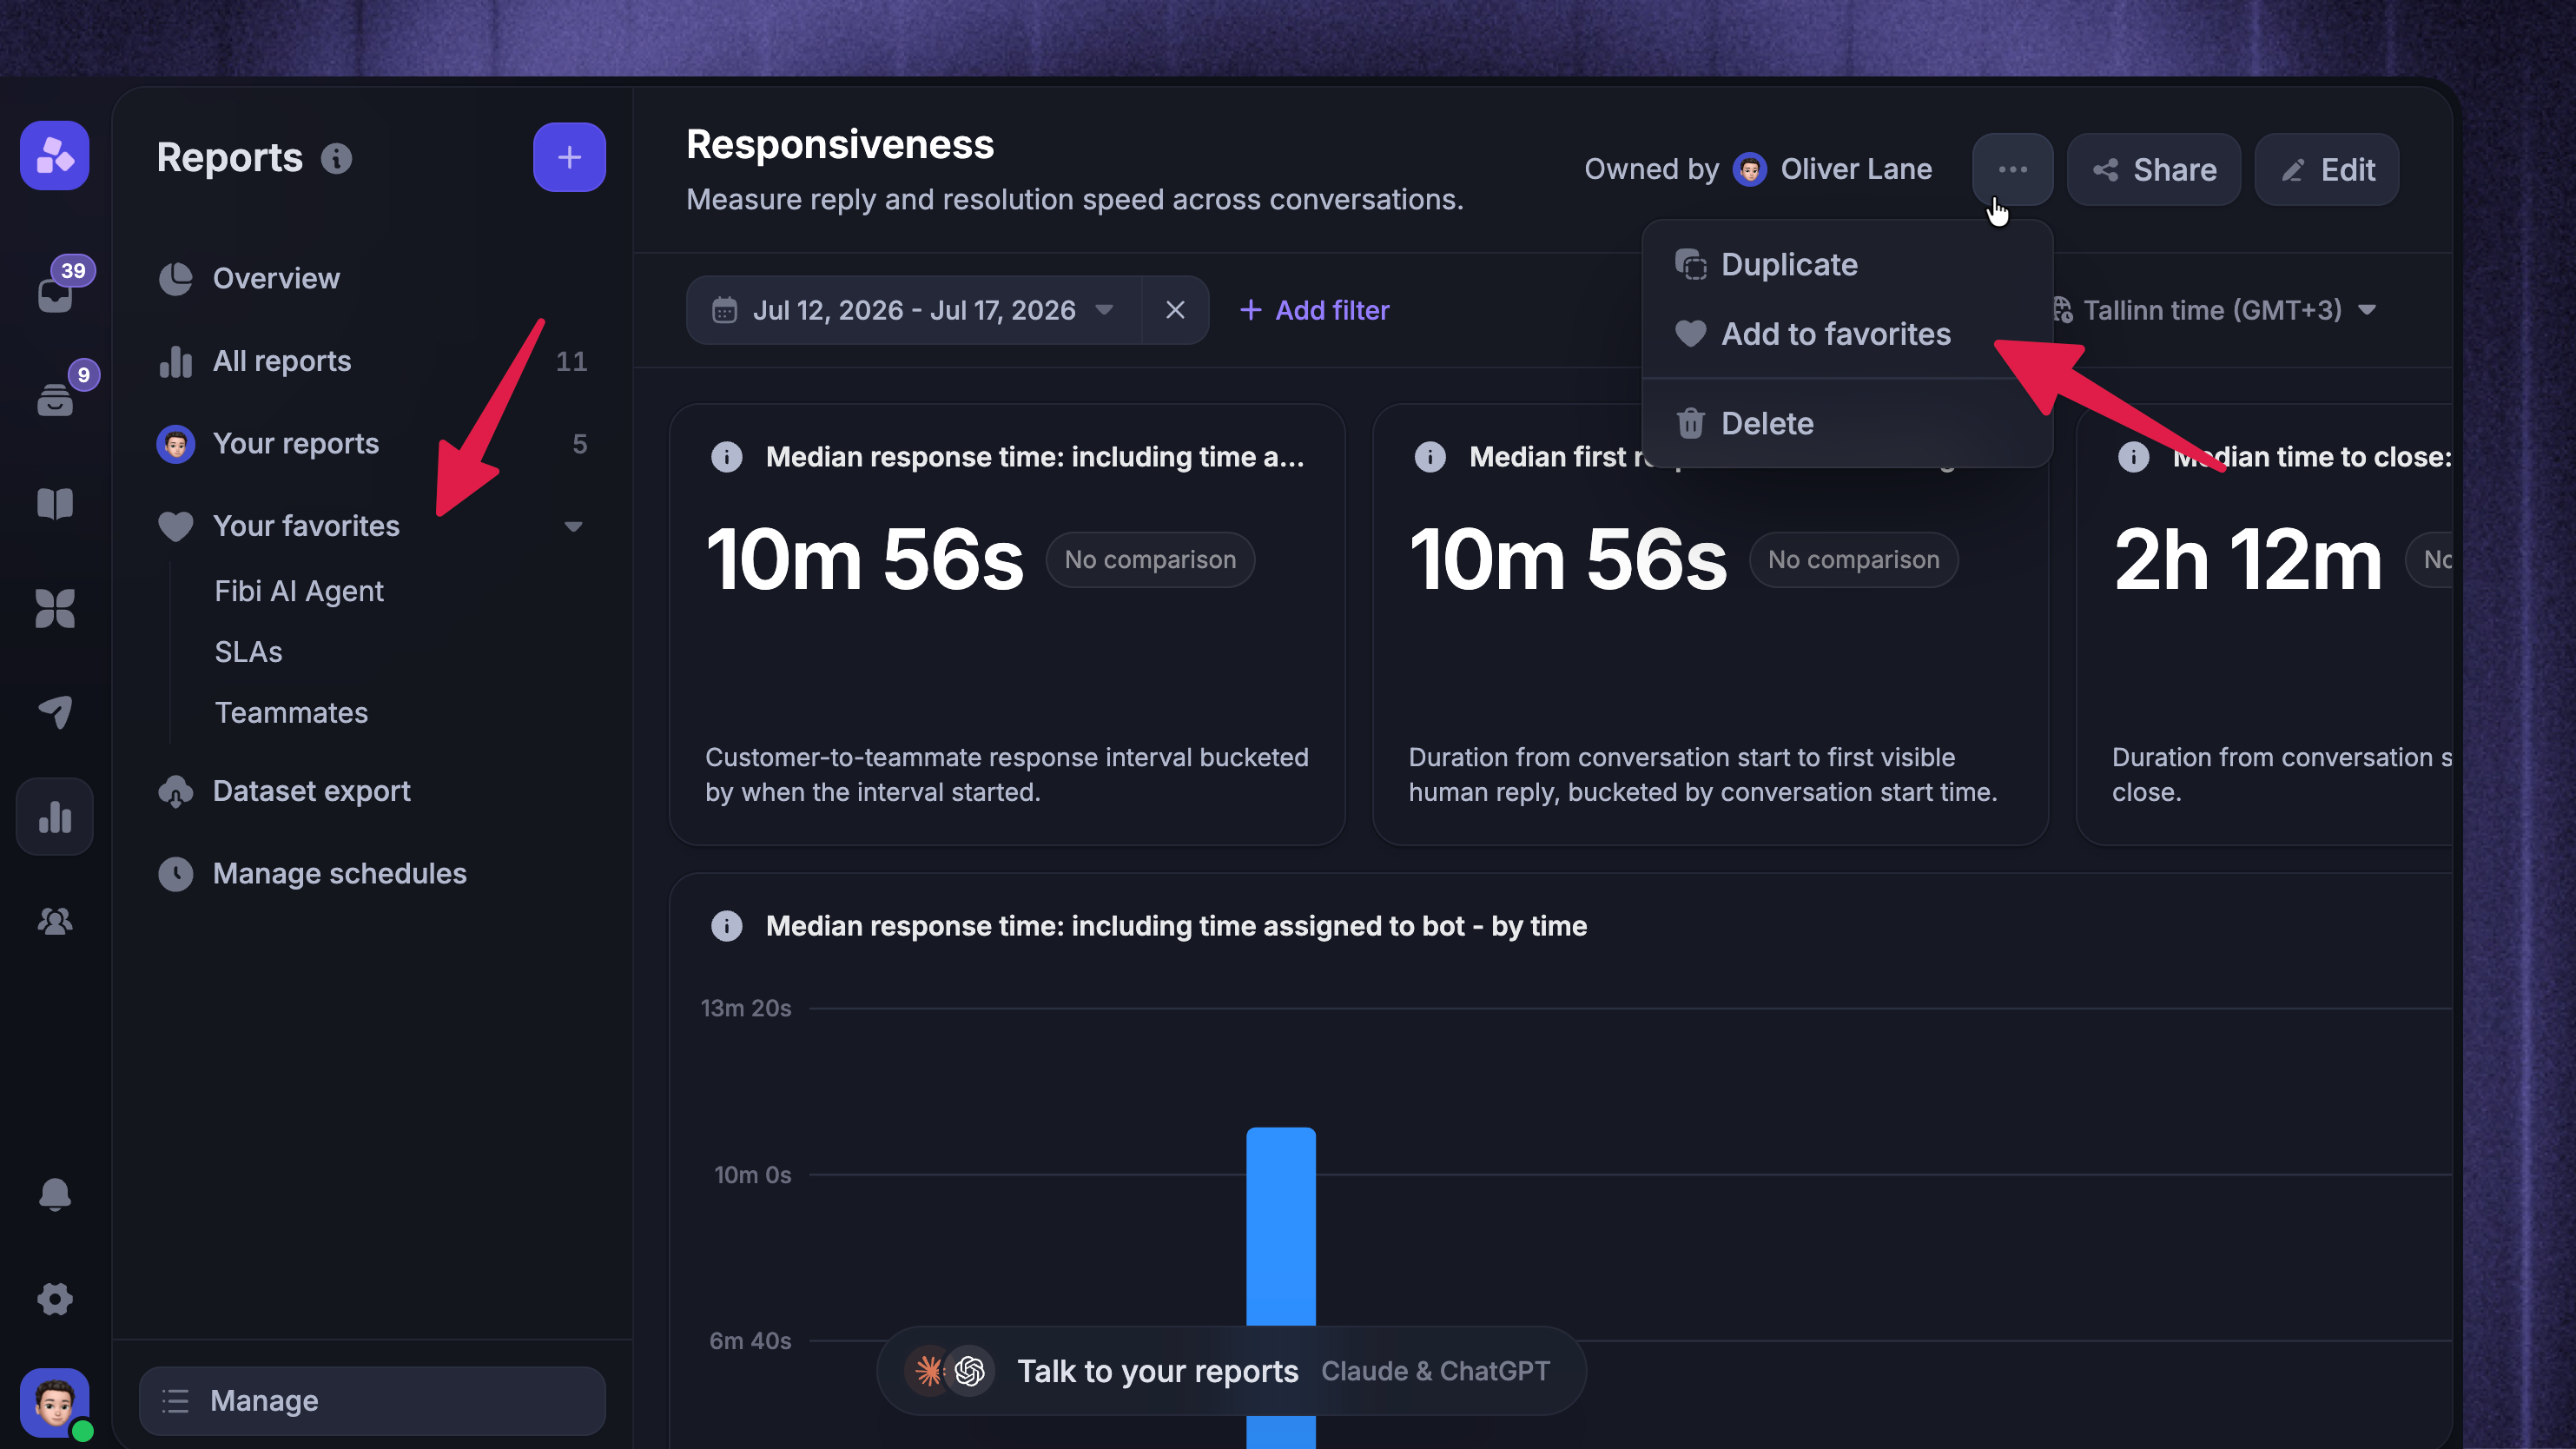
Open a report and click More actions → Add to favorites. Favorites are personal and appear under Your favorites in the Reports sidebar.
Export data
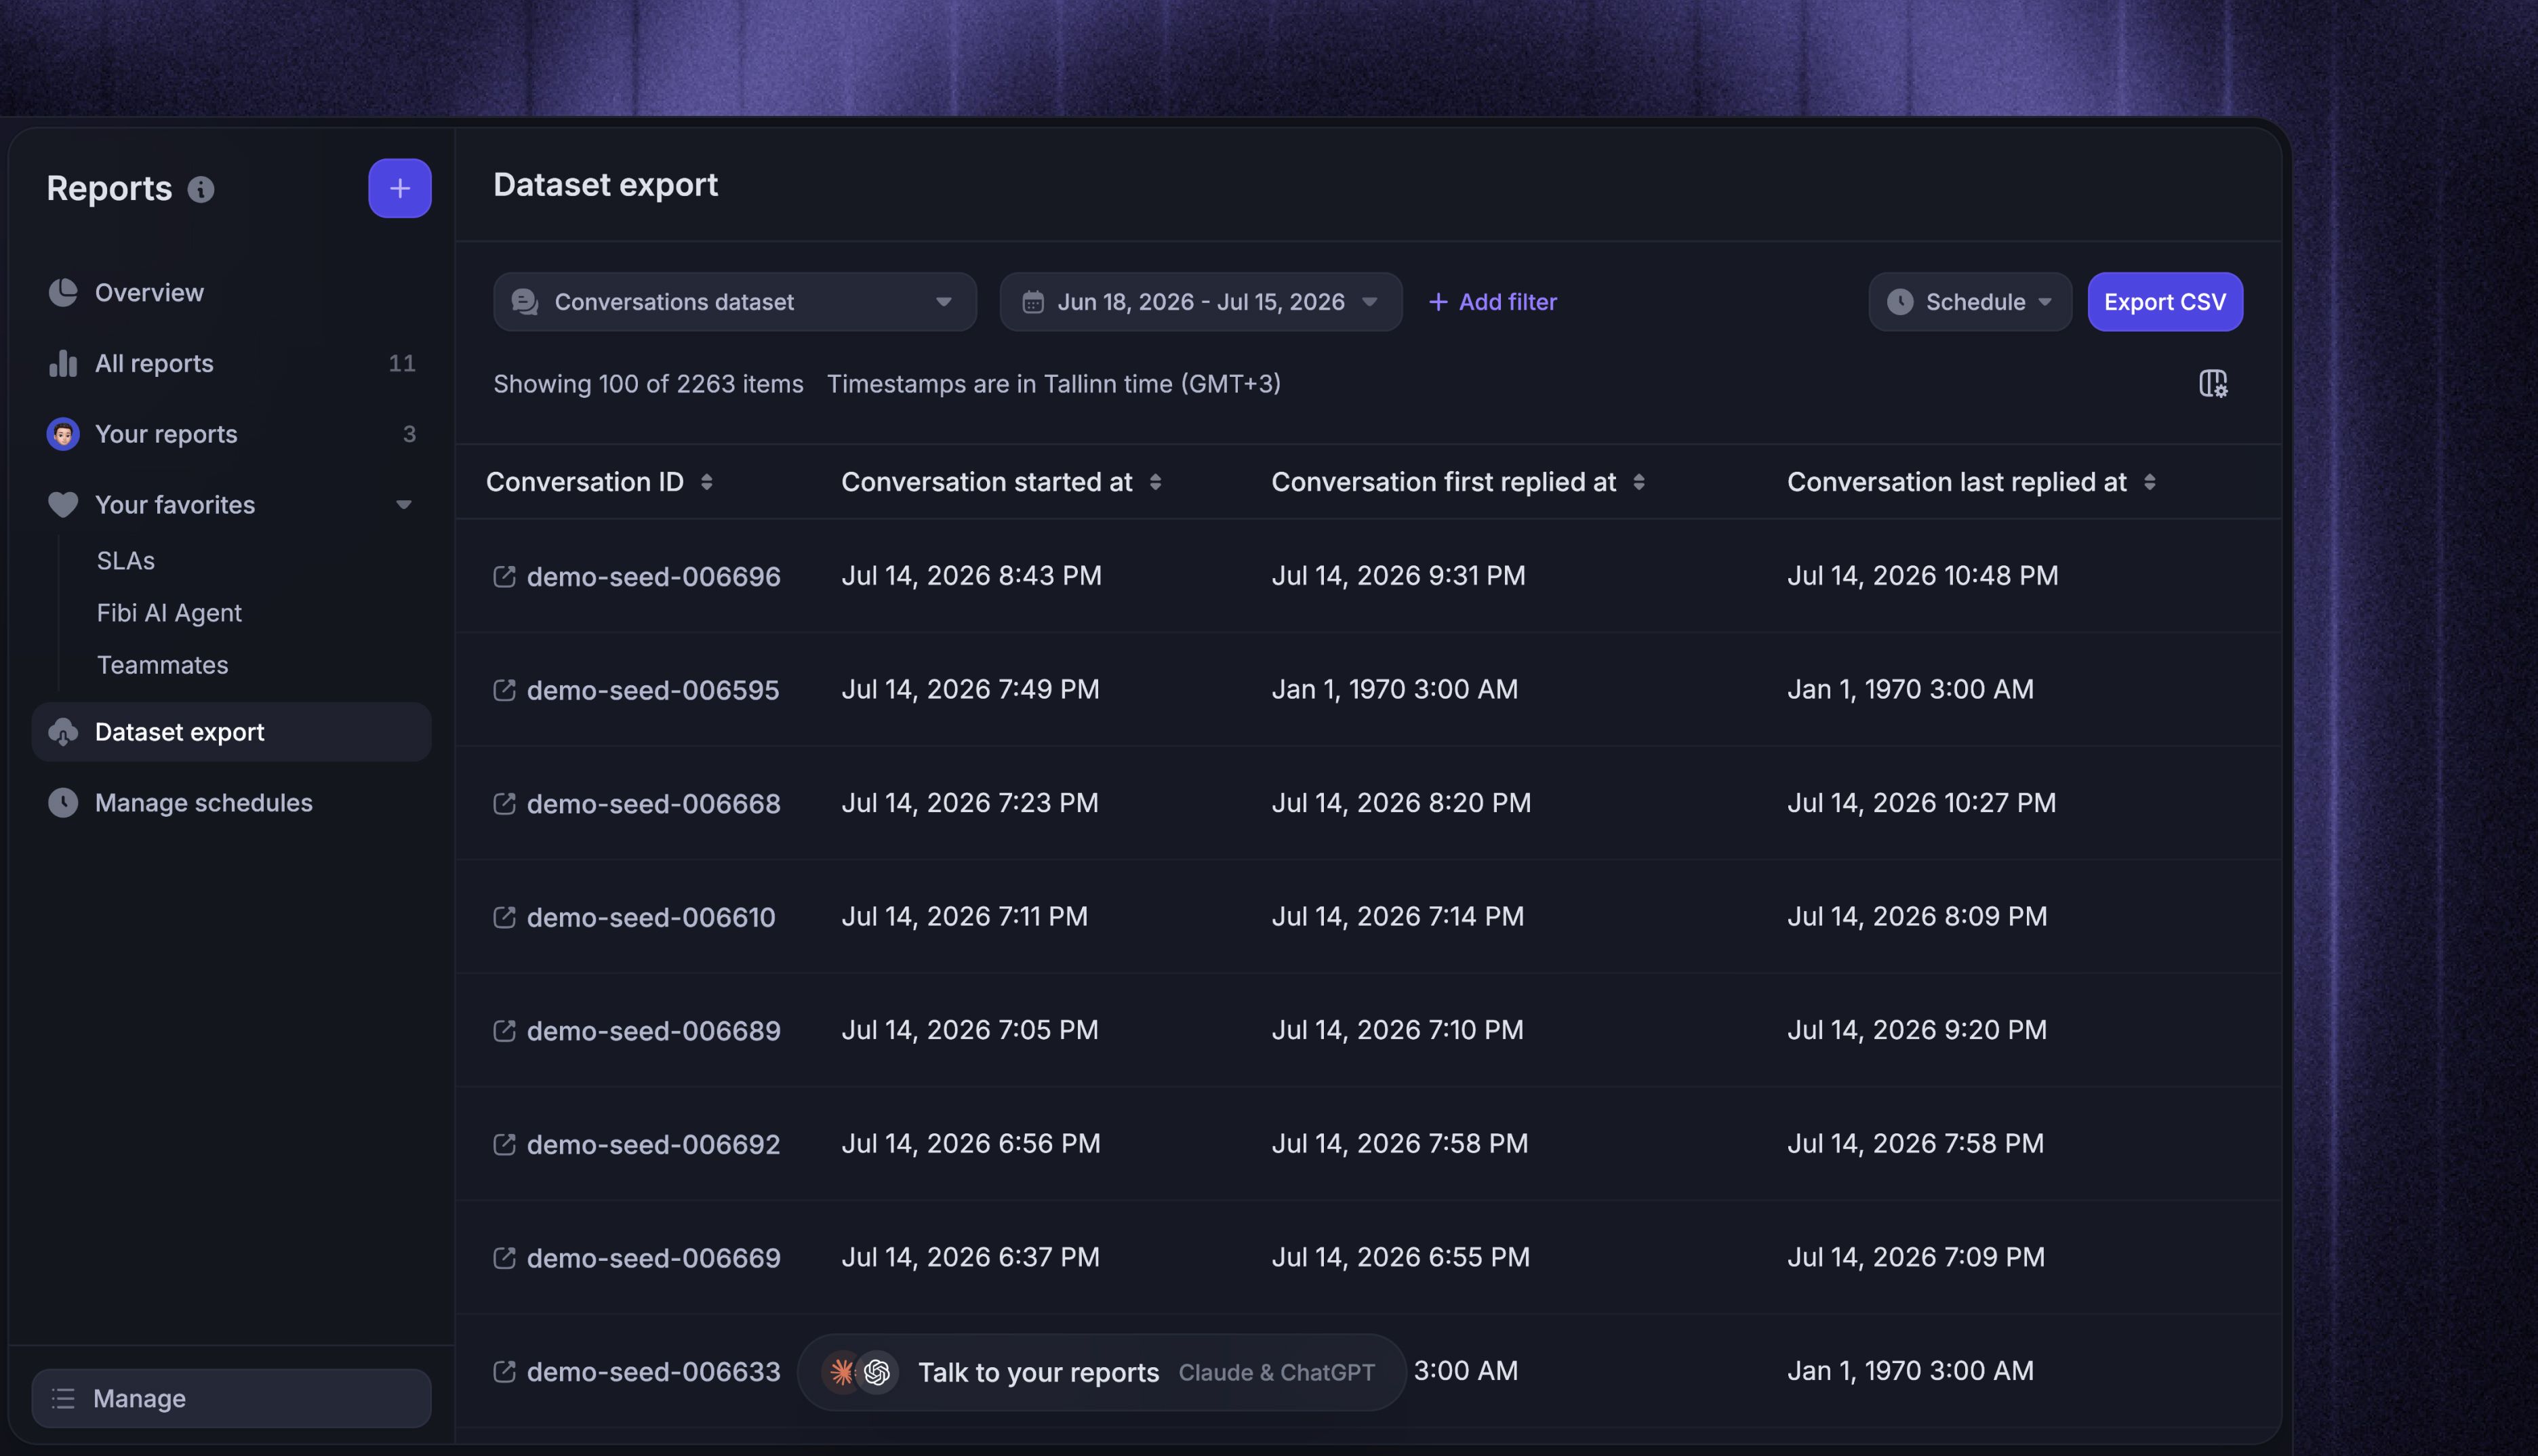
Export the calculated values or raw rows behind a chart, download the rows in a drill-in, or build a filtered CSV export from one of the reporting datasets. Dataset exports can also run on a recurring schedule.
Tip: For programmatic analysis, use the public Reports API or connect AI tools through the Featurebase MCP.
Was this helpful?
Still need help? Ask the team