Tickets reporting
Track ticket volume, time in each state, and resolution speed across teams and teammates with the built-in Tickets report template.
Written By Markus Palm
Last updated 8 days ago
Overview
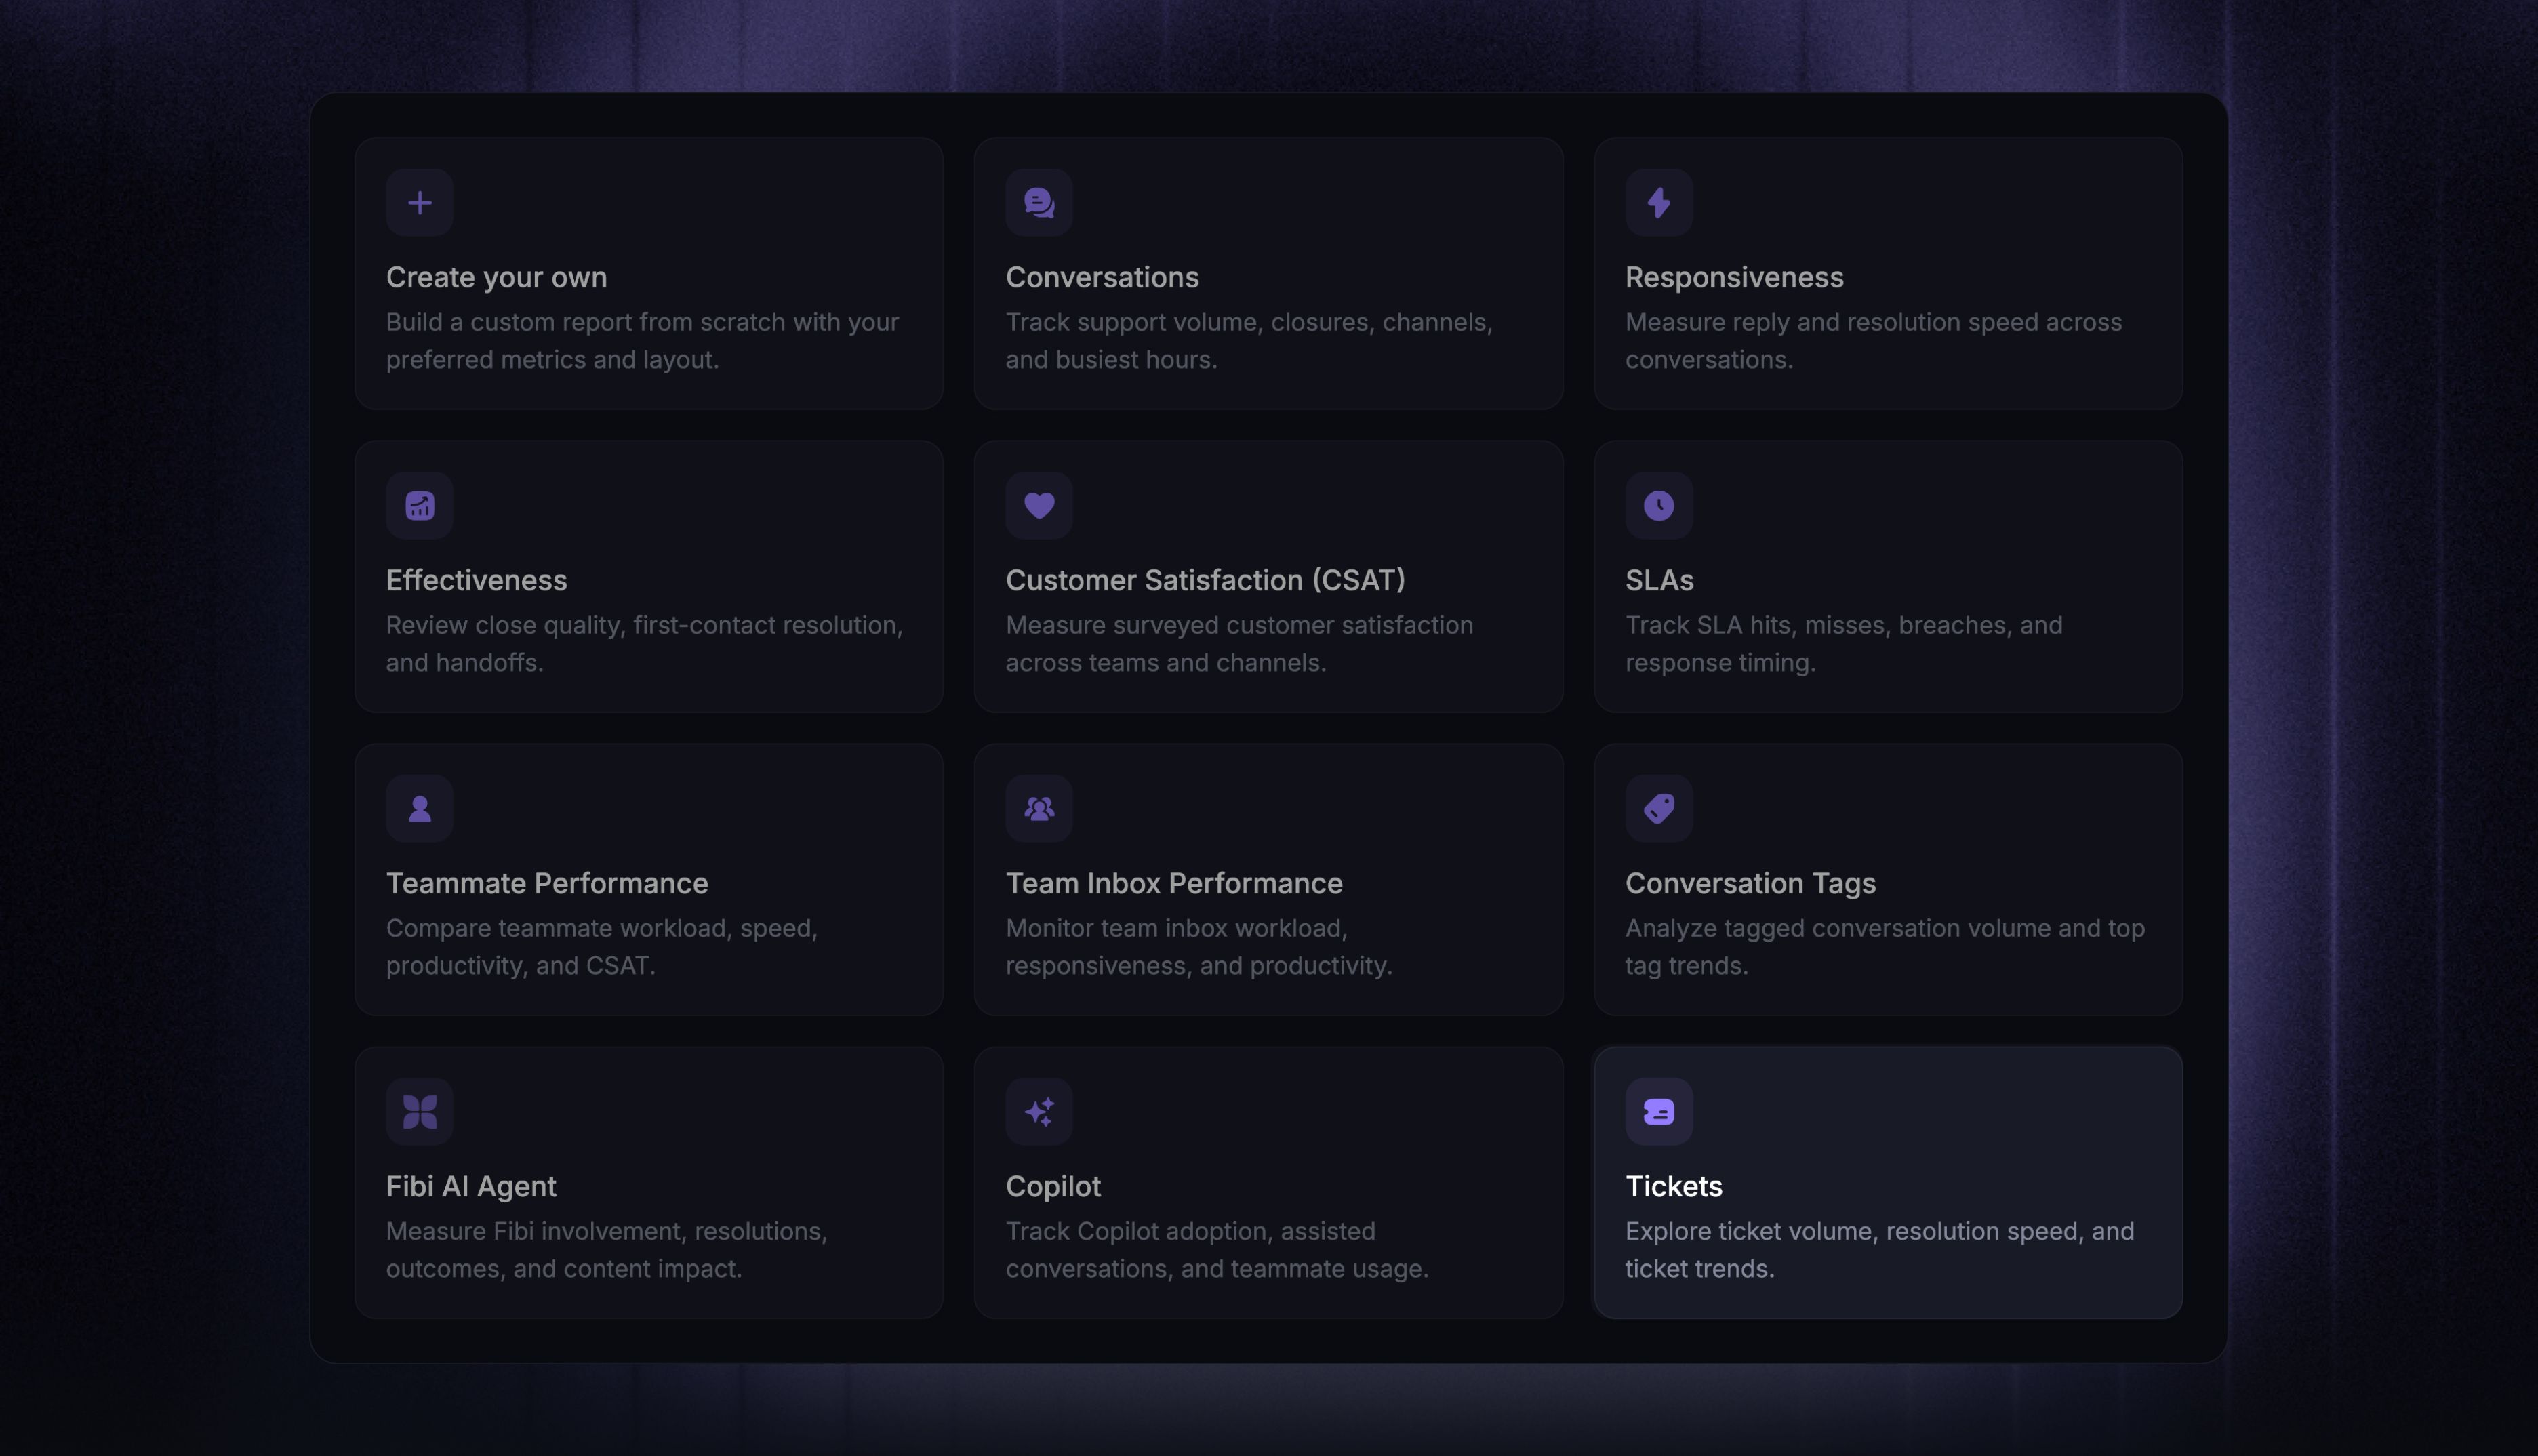
The ‘Tickets’ template gives you a ready-made view of your ticket operations: how many tickets your team receives and resolves, how long tickets sit in each state, and how quickly they get resolved.
Go to the Reports tab and create a new report. Select the ‘Tickets’ template to get started quickly.
Note: You can also combine reporting metrics and attributes to create your own custom report.
Ticket resolution and state times
The top of the template answers how fast tickets move:
‘Median ticket time to resolve’ - the median time from ticket creation to the latest resolved timestamp
‘Median ticket time in submitted’, ‘Median ticket time in progress’, and ‘Median ticket time in waiting on customer’ - the median time tickets spend in each state category
Your custom ticket states map to six standard categories:
Submitted
In progress
Waiting on customer
Resolved
Canceled
Reviewing
This keeps the charts comparable no matter how many custom states your workspace defines.
Below the KPIs, three charts break down resolution speed:
‘Median ticket time to resolve - by time’ - trends resolution speed over the selected period
‘Median ticket time to resolve - by team assigned’ - groups it by Team currently assigned
‘Median ticket time to resolve - by teammate assigned’ - groups it by Teammate currently assigned
Resolution-time settings work as follows:
All hours - the default, so nights and weekends count
Within office hours - excludes time outside your workspace schedule in a copy of the template
Ticket time in state - always measures calendar time
Tip: Hover a chart and click Drill-in to see the tickets behind a number, or hover the info icon next to a chart title to check its metric, Timestamp, Aggregation, and office-hours state.
Ticket volume
The lower half of the template tracks throughput:
‘New tickets’ - tickets created during the selected period
‘Resolved tickets’ - tickets whose most recent resolved transition happened during the period
‘Comparison of New and Resolved Tickets’ - both counts over time, showing whether your team is keeping up with incoming volume
‘Ticket volume - by team assigned’ and ‘Ticket volume - by teammate assigned’ - new tickets split by Team currently assigned and Teammate currently assigned
These assignment breakdowns use the ticket's live current assignee, so reassigning a ticket moves it to the new team or teammate in every period.
Customize this report
Your copy of the template is a regular custom report: rename, remove, resize, or reconfigure any chart, and add your own.
The report starts with a Ticket type filter in the header, ready to scope every chart to specific ticket types. Other useful filters and breakdowns:
Ticket category - split customer, back-office, and tracker tickets
Current ticket custom state - filter to tickets sitting in a specific state right now
Team currently assigned, Teammate currently assigned, channel, tags, and customer or company attributes
To report on time spent in each state, add a chart with the Ticket time in state metric. Then choose a breakdown:
Ticket custom state - compare your workspace's individual states
Ticket state category - compare the standard categories
Note: Current ticket custom state filters by where a ticket sits now. Ticket custom state on the Tickets time in state dataset identifies the historical state interval being measured and cannot break down Ticket time to resolve, which comes from the Tickets dataset.
Learn more about customizing reports →
Tickets report use cases
Balance incoming and resolved ticket volume
Compare ‘New tickets’ with ‘Resolved tickets’ to see whether your team is keeping up with incoming work. If new tickets consistently outpace resolved tickets, review staffing or ticket routing before the backlog grows.
Find where tickets spend the most time
Use the median time-in-state KPIs to identify whether tickets wait longest in Submitted, In progress, or Waiting on customer. Add a Ticket time in state chart when you need to compare your workspace's individual custom states.
Compare resolution speed across teams
Use ‘Median ticket time to resolve - by team assigned’ and ‘Median ticket time to resolve - by teammate assigned’ to find where tickets move quickly and where additional coverage or process changes may help.
FAQs
How do tickets relate to conversations in Reports?
How do tickets relate to conversations in Reports?
Tickets use two datasets that are separate from conversations:
Tickets - one row per ticket
Tickets time in state - one row per state interval
Ticket rows carry properties of the linked conversation, such as channel and tags, so you can filter tickets by them.
Reporting datasets describes what each dataset contains.
When does a ticket count as resolved?
When does a ticket count as resolved?
A ticket counts as resolved when it moves into a state in the Resolved category:
‘Resolved tickets’ - counts each ticket by its most recent resolved transition; a ticket that is reopened and resolved again counts in the period of the latest resolution
Ticket time to resolve - measures from creation to that latest resolved timestamp
Can I calculate a ticket reopen rate?
Can I calculate a ticket reopen rate?
Reports does not include a built-in ticket reopen count or reopen rate.
Use a Tickets time in state dataset export when you need to identify tickets that entered a resolved state and later moved back to a non-resolved state, then calculate the rate outside Featurebase.
Reopened conversations does not measure ticket state changes.
Do the time-in-state charts adjust for office hours?
Do the time-in-state charts adjust for office hours?
No. Ticket time in state always measures calendar time; only Ticket time to resolve supports the Within office hours adjustment.
Why can a ticket and its linked conversation show different states?
Why can a ticket and its linked conversation show different states?
Ticket and conversation states are tracked separately. Changing a ticket's state does not automatically close its linked conversation. You can automate ticket actions with Workflows when you need the two to stay in sync.
Was this helpful?
Still need help? Ask the team