Conversation Tags reporting
Track how many conversations get tagged, which conversation tags are used most, and how tag volume trends over time in Featurebase Reports.
Written By Markus Palm
Last updated 8 days ago
Overview
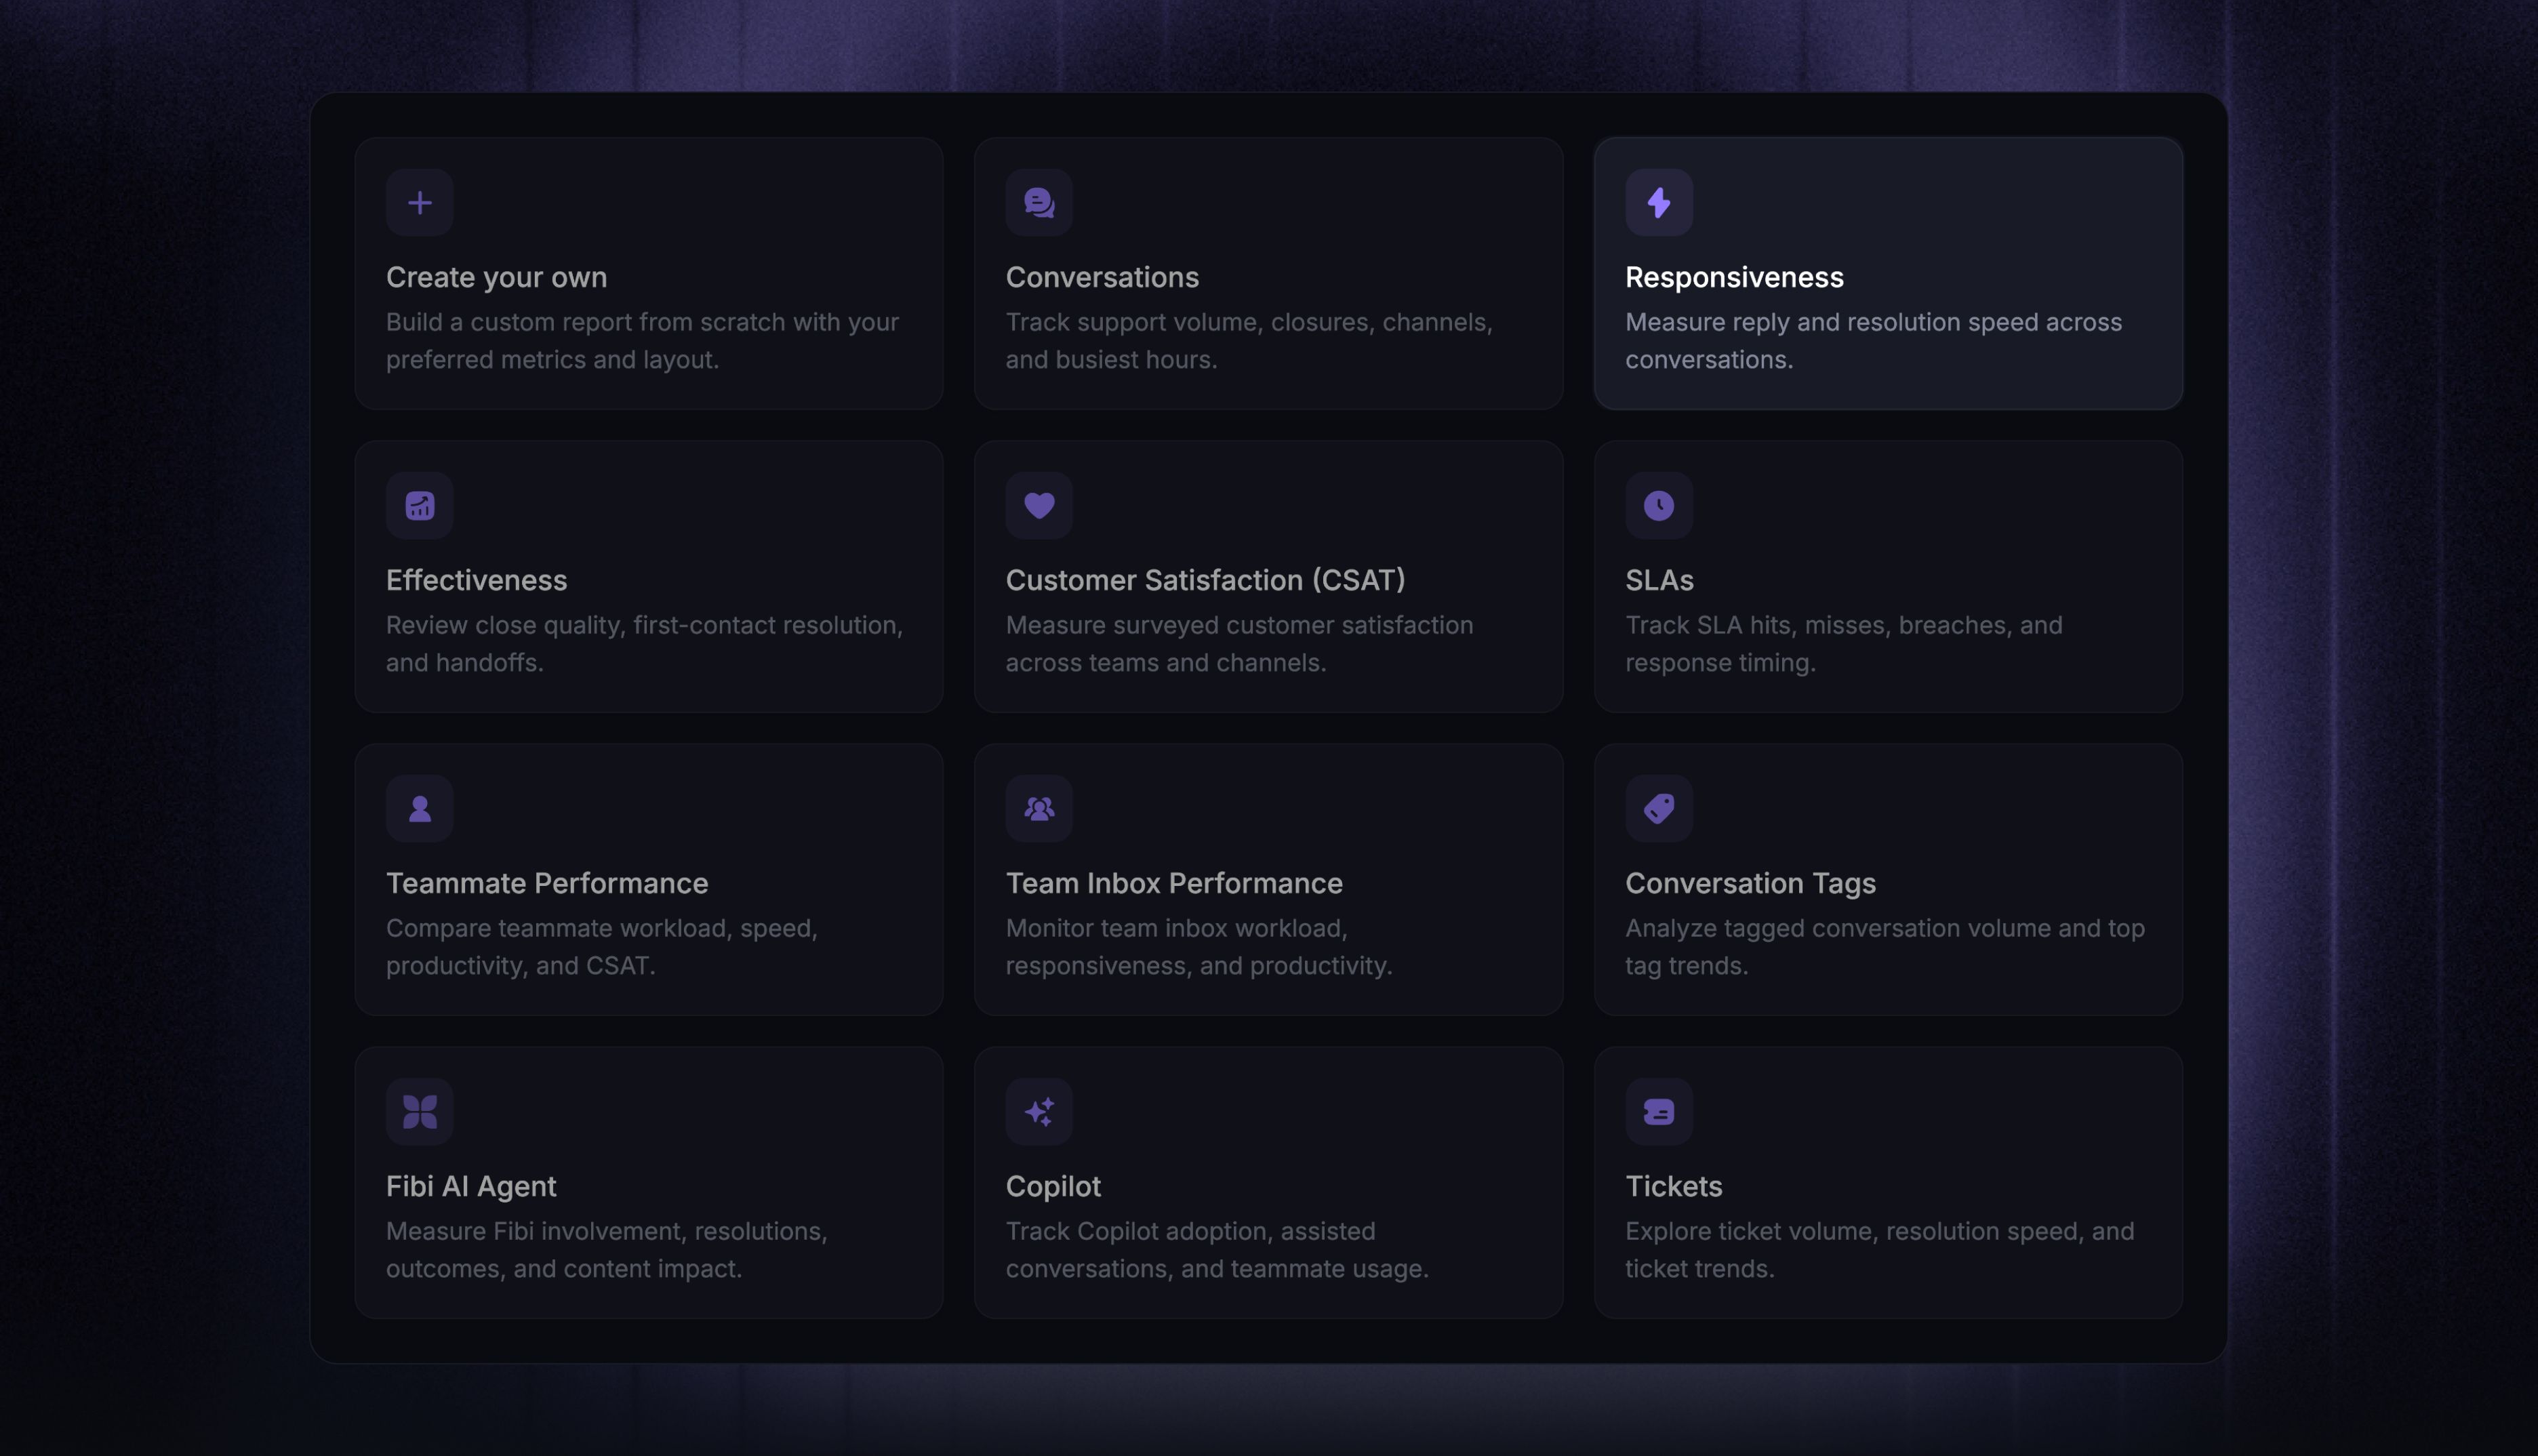
The ‘Conversation Tags’ report shows how much of your conversation volume is tagged and which tags come up most often. Tags are labels your team applies to conversations, so this report shows how your team categorizes support volume at scale.
Go to the Reports tab and create a new report. Select the ‘Conversation Tags’ template to get started quickly.
Note: You can also combine reporting metrics and attributes to create your own custom report.
Conversation tag insights
New conversations and Tagged conversations
Two KPIs summarize the selected period:
‘New conversations’ - every conversation created in the period
‘Tagged conversations’ - conversations created in the period that currently have at least one conversation tag
Compare the two to see your tagging coverage - the gap is your untagged volume.
Note: Tag charts use the conversation's start date, while Conversation tag reflects the tags currently applied. Adding or removing a tag can therefore change results for an earlier period. A conversation tagged days after it started still counts toward the period it started in.
Tagged conversations - by time
This chart trends tagged conversations across the date range, so you can spot spikes in tagged volume and see how tagging holds up over time. When a period stands out, narrow the report's date range to that period, then use the table below to see which tags drove it.
Most used conversation tags
This table ranks the tags represented by conversations in the selected period by New conversations, most used first, showing which tags dominate your support volume.
Note: A conversation can hold several tags, and it is counted under every tag it matches - a conversation with two tags appears in both rows, so the rows add up to more than your total conversation count.
Hover the info icon next to any chart title to check its metric description, Timestamp, Aggregation, and applied filters.
Customize this report
Templates are read-only starting points. Click Use this template to create your own report seeded with these charts - the built-in template stays unchanged for the rest of your team. From there, rename, remove, or reconfigure charts like in any custom report.
Useful filters
Conversation tag - focus on one or more tags; selecting several values in one filter includes conversations with any of the selected tags
Channel or Conversation initiator type - compare how conversations are categorized by where they arrived or who started them
Teammate - for the conversation-volume metrics in this template, the dynamic teammate filter uses Teammate currently assigned
You can also change the date range to compare tag volume across weeks or months. In the chart builder, group other metrics by Conversation tag - for example, first response time or CSAT score by tag.
Learn more about customizing reports →
Conversation tags report use cases
See how often a conversation tag is being used
Filter by Conversation tag - for example, *Bug report* - then use ‘Tagged conversations - by time’ to see how often the tag appears and whether its volume is increasing or decreasing.
Find out which are the most used conversation tags
‘Most used conversation tags’ highlights the tagged conversation types driving the most volume, helping you spot high-volume issues or routing bottlenecks. Use Drill-in to view or export the conversations and spot-check their tags.
FAQs
Why do the tag counts add up to more than my total conversations?
Why do the tag counts add up to more than my total conversations?
Because Conversation tag is a multi-value attribute: a conversation with several tags is counted under each of them. This is expected. Compare individual tag rows against the ‘Tagged conversations’ KPI, not against each other's sum.
Do untagged conversations appear in this report?
Do untagged conversations appear in this report?
Only in some charts:
‘New conversations’ includes them
‘Tagged conversations’ excludes them
‘Most used conversation tags’ has no row for them
The difference between the two KPIs tells you how many conversations went untagged.
A conversation was tagged after it started - when does it show up?
A conversation was tagged after it started - when does it show up?
Under the period the conversation started, since tag charts bucket conversations by start time.
Tags in Reports are current-state attributes: once a tag is applied, the conversation counts toward that tag shortly after, and if you remove a tag, the conversation drops out of that tag's numbers.
Can I report on when or who applied a tag?
Can I report on when or who applied a tag?
No.
Reports shows the tags currently applied to a conversation but does not expose the tag application itself as a reporting event or timestamp.
Tag charts are therefore grouped by the conversation's start date, not by when or by whom a tag was applied.
Was this helpful?
Still need help? Ask the team