Team Inbox Performance reporting
Track each team's workload, responsiveness, and resolution speed in Featurebase Reports with the built-in Team Inbox Performance template.
Written By Markus Palm
Last updated 7 days ago
Overview
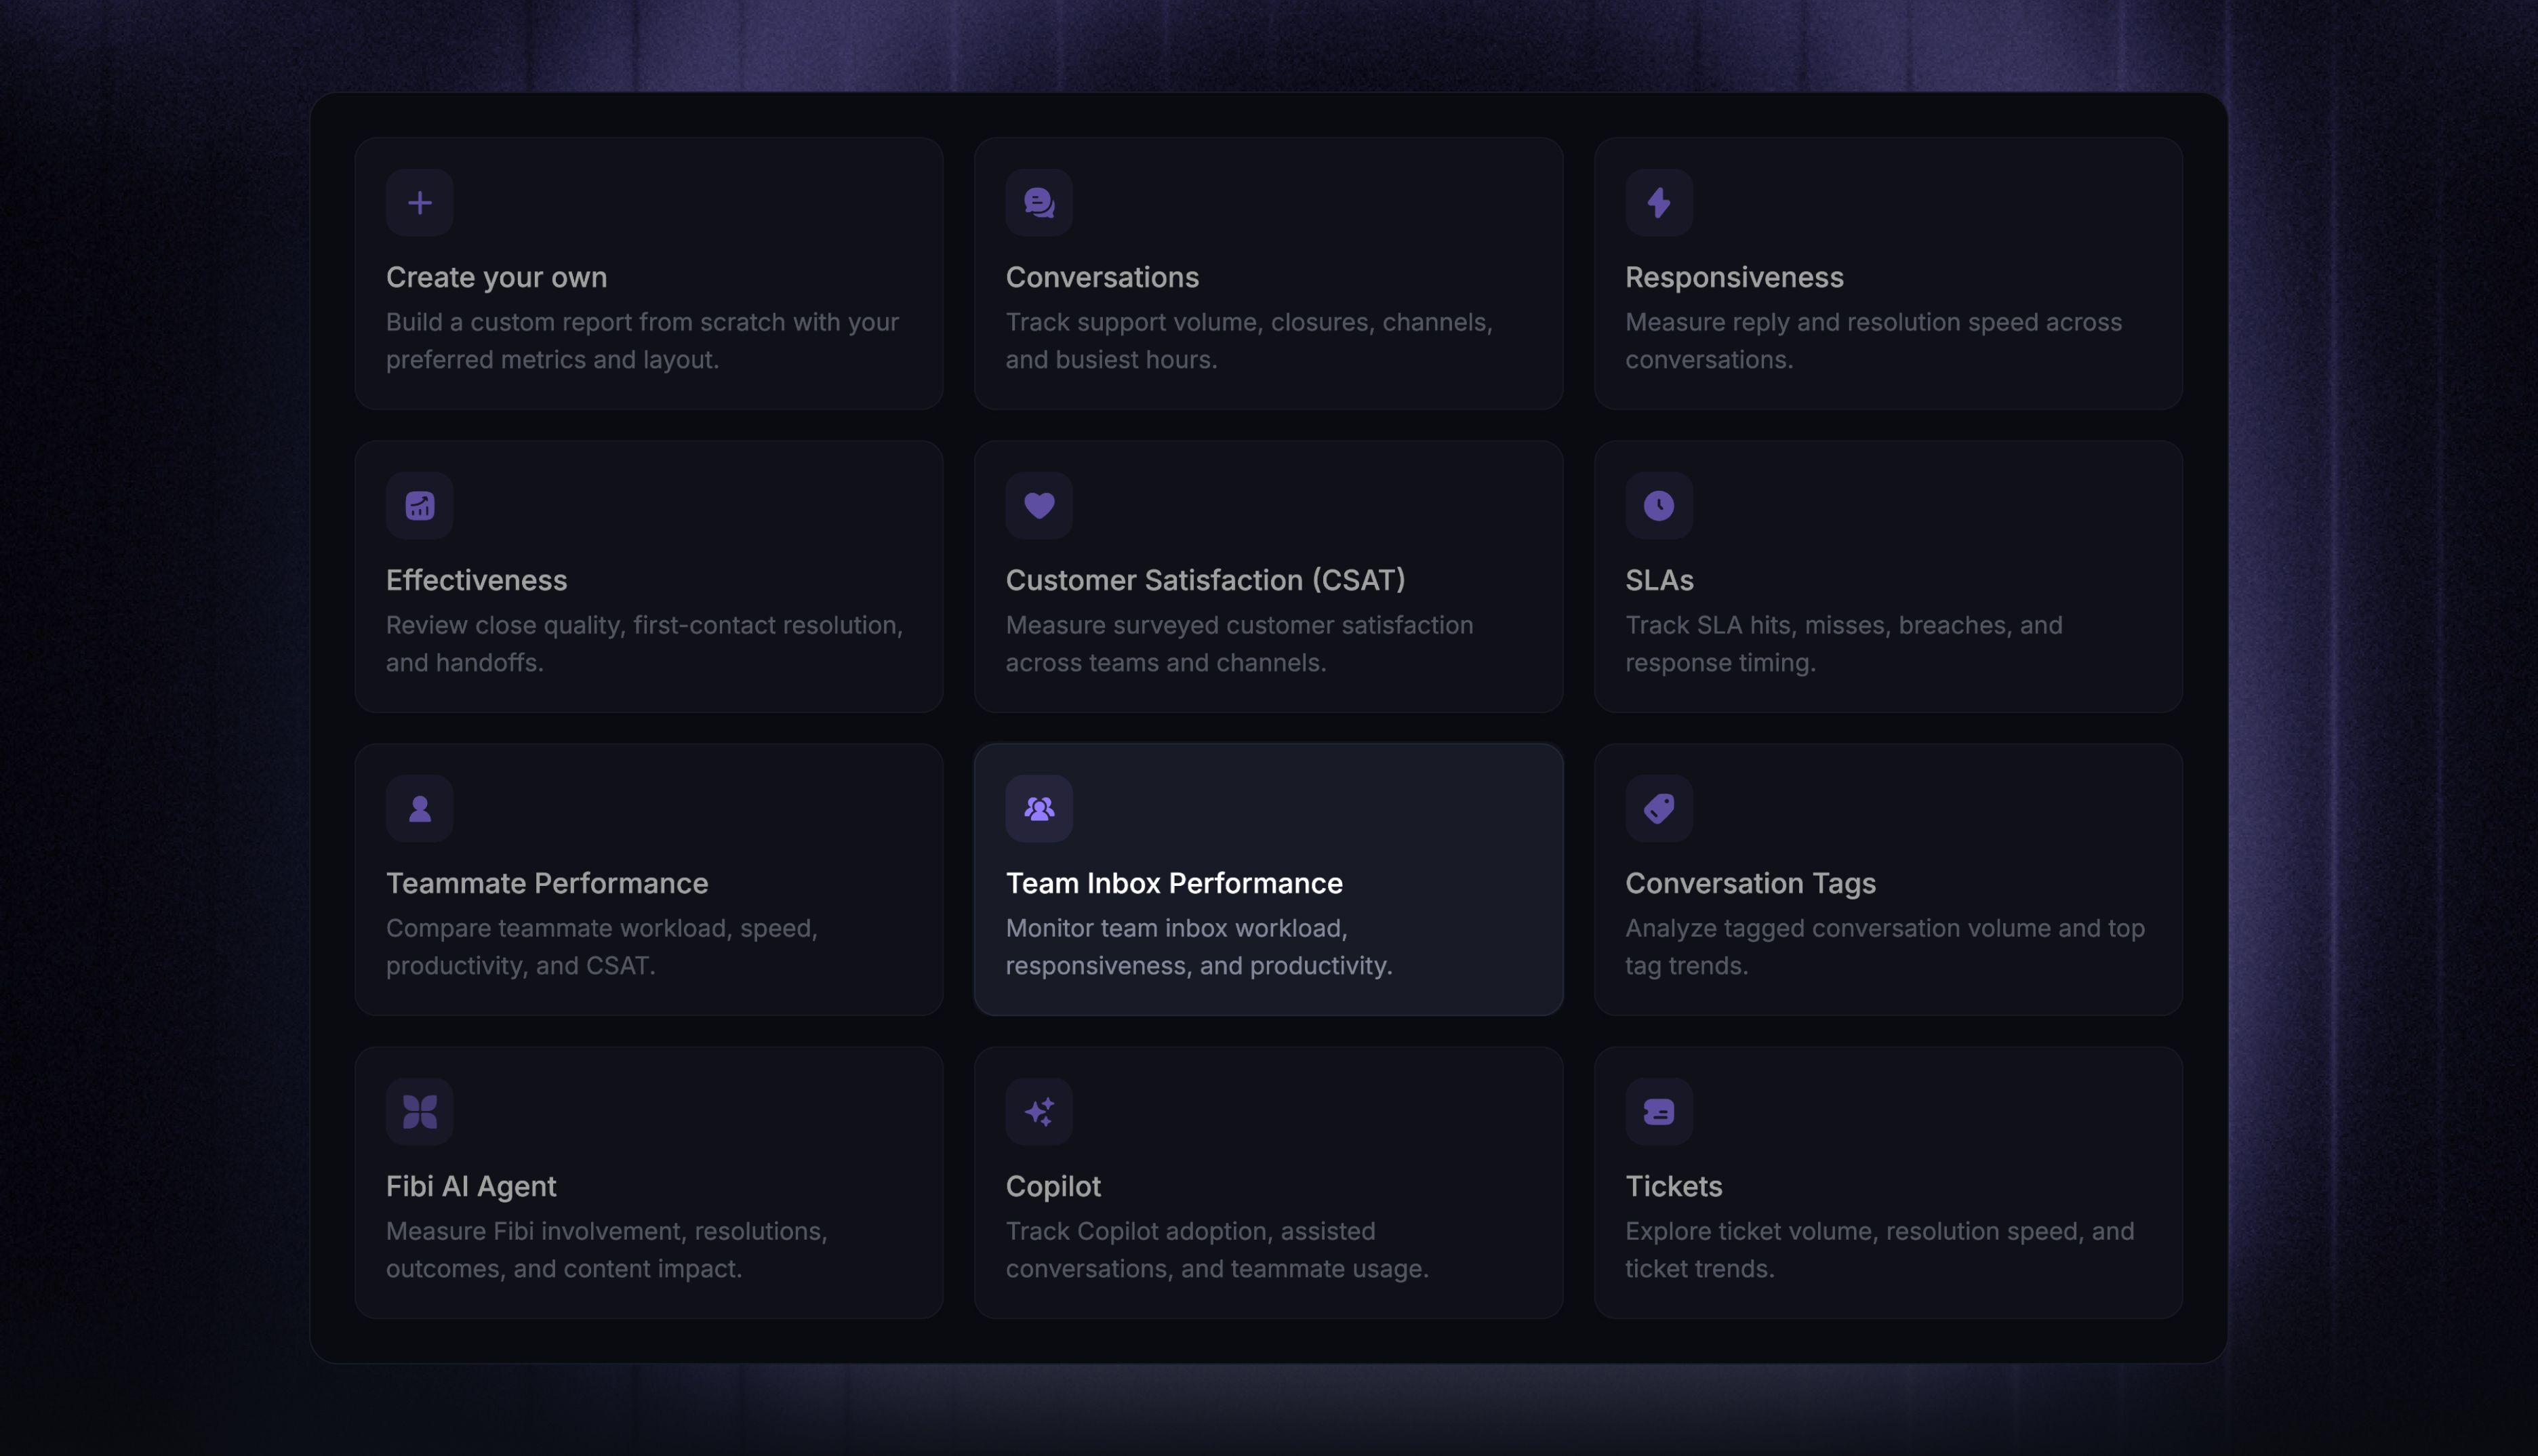
The ‘Team Inbox Performance’ template monitors team inbox workload, responsiveness, and productivity. Where ‘Teammate Performance’ looks at individual teammates, this template answers the same questions at the team level.
Go to the Reports tab and create a new report. Select the ‘Team Inbox Performance’ template to get started quickly.
Note: You can also combine reporting metrics and attributes to create your own custom report.
Team inbox performance
Team inbox KPIs
The top row measures response and resolution speed, as medians so a few outliers do not skew the picture:
‘Team assignment to first response’ - median time from when a conversation is assigned to a team inbox until the first response
‘Team assignment to subsequent response’ - median time to each additional teammate response after the first response while the conversation is assigned to the team inbox
‘Team assignment to close’ - median time from when a conversation is assigned to a team inbox until the last teammate close while that team is responsible
These clocks start when the conversation is assigned to the team inbox, so earlier time in the Bot inbox or a queue is excluded. They use All hours by default. When you select Within office hours, Reports uses the team's custom office hours or falls back to the workspace default.
The second row counts the team's workload in the selected period:
‘Conversations assigned’ - unique conversations assigned to the team
‘Conversations replied to’ - unique conversations where the team sent at least one reply
‘Closed conversations’ - times a conversation was closed while owned by the team; a close after a reopen counts again
Tip: Hover the info icon next to any chart title to see exactly what it measures, including the metric description, timestamp, aggregation, and office-hours state.
Teammate Activity
The ‘Teammate Activity’ column chart trends three metrics together:
Conversations assigned
Conversations replied to
Closed conversations
When the assigned column keeps outgrowing the closed column, the team may be building a backlog - a signal to rebalance before response times slip.
Comparison of Team inbox performance
The ‘Comparison of Team inbox performance’ table shows one row per team plus a summary row, so you can compare teams without building separate reports.
Each row combines the volume counts and median speed metrics from the KPIs above with three collaboration counts:
Replies sent
Notes created
Mentions
Read it by scanning for imbalance: a team with high assigned volume and a long close time may need reinforcement, while similar volumes with very different response medians can point to a process difference.
How team attribution works
Every chart in this template credits work to the team based on what happened, not on who holds the conversation now:
Response time and reply charts - Team replied to, the team associated with the teammate reply
Assignment and time-to-close charts - Team assigned, the team whose assignment starts the clock and that is still responsible at the last teammate close
Close, note, and mention counts - Team at action time, the team that owned the conversation when the action happened
These historical attributions are fixed at the moment of the action and never move afterwards. Team currently assigned instead follows the conversation or ticket's current team. The Teammate filters in reports article explains current and action-anchored filters in depth.
Customize this report
The built-in template is read-only. Click Use this template to create your own report seeded with these charts - rename, remove, or reconfigure any of them, and add your own charts on top. The template itself stays unchanged for the rest of your team.
Useful filters and adjustments
Your copy starts with the dynamic Team filter in the report header. Select a team to scope every chart using the metric-specific attributions described above.
Break a chart down by Channel or Conversation tag to see where a team's volume comes from
Hover a chart and click Drill-in to inspect the underlying conversations behind any number
Learn more about customizing reports →
Team inbox performance report use cases
Monitor team inbox responsiveness
Compare the team assignment metrics to see how quickly each team responds to and closes conversations after assignment. A slower first response than subsequent response can point to a coverage or routing problem at intake.
Manage workload and resource allocation effectively
Use ‘Teammate Activity’ to compare conversations assigned, replied to, and closed over time. If assignments consistently outpace closes, rebalance work before the backlog affects response times.
Compare team inbox performance
Use ‘Comparison of Team inbox performance’ to find teams with similar workloads but different response or close times, then compare their replies, notes, and mentions for clues about how they work.
FAQs
Why don't team totals match the sum of my teammates' numbers?
Why don't team totals match the sum of my teammates' numbers?
They count differently for two reasons:
Unique counting - team charts like ‘Conversations replied to’ count unique conversations per team, so a conversation two teammates replied to counts once for their team but once for each teammate in a per-teammate view
Attribution - teammate metrics anchor to who replied or closed, while team volume anchors to team assignment, so a conversation can match a teammate without matching their team
Why does work still count for a team after a teammate left it?
Why does work still count for a team after a teammate left it?
Action-anchored work stays with the team that performed it, even after a teammate changes teams or leaves the workspace. Team currently assigned instead follows the conversation or ticket's current team.
Do conversations without a team appear in this report?
Do conversations without a team appear in this report?
Charts filtered by Team only include conversations attributed to that team, so conversations with no team attribution do not count toward any team's numbers. Clear the Team filter to see workspace-wide activity instead.
Was this helpful?
Still need help? Ask the team