Responsiveness reporting
Track how quickly your team replies to and resolves conversations with the built-in Responsiveness report template in Featurebase Reports.
Written By Markus Palm
Last updated 7 days ago
Overview
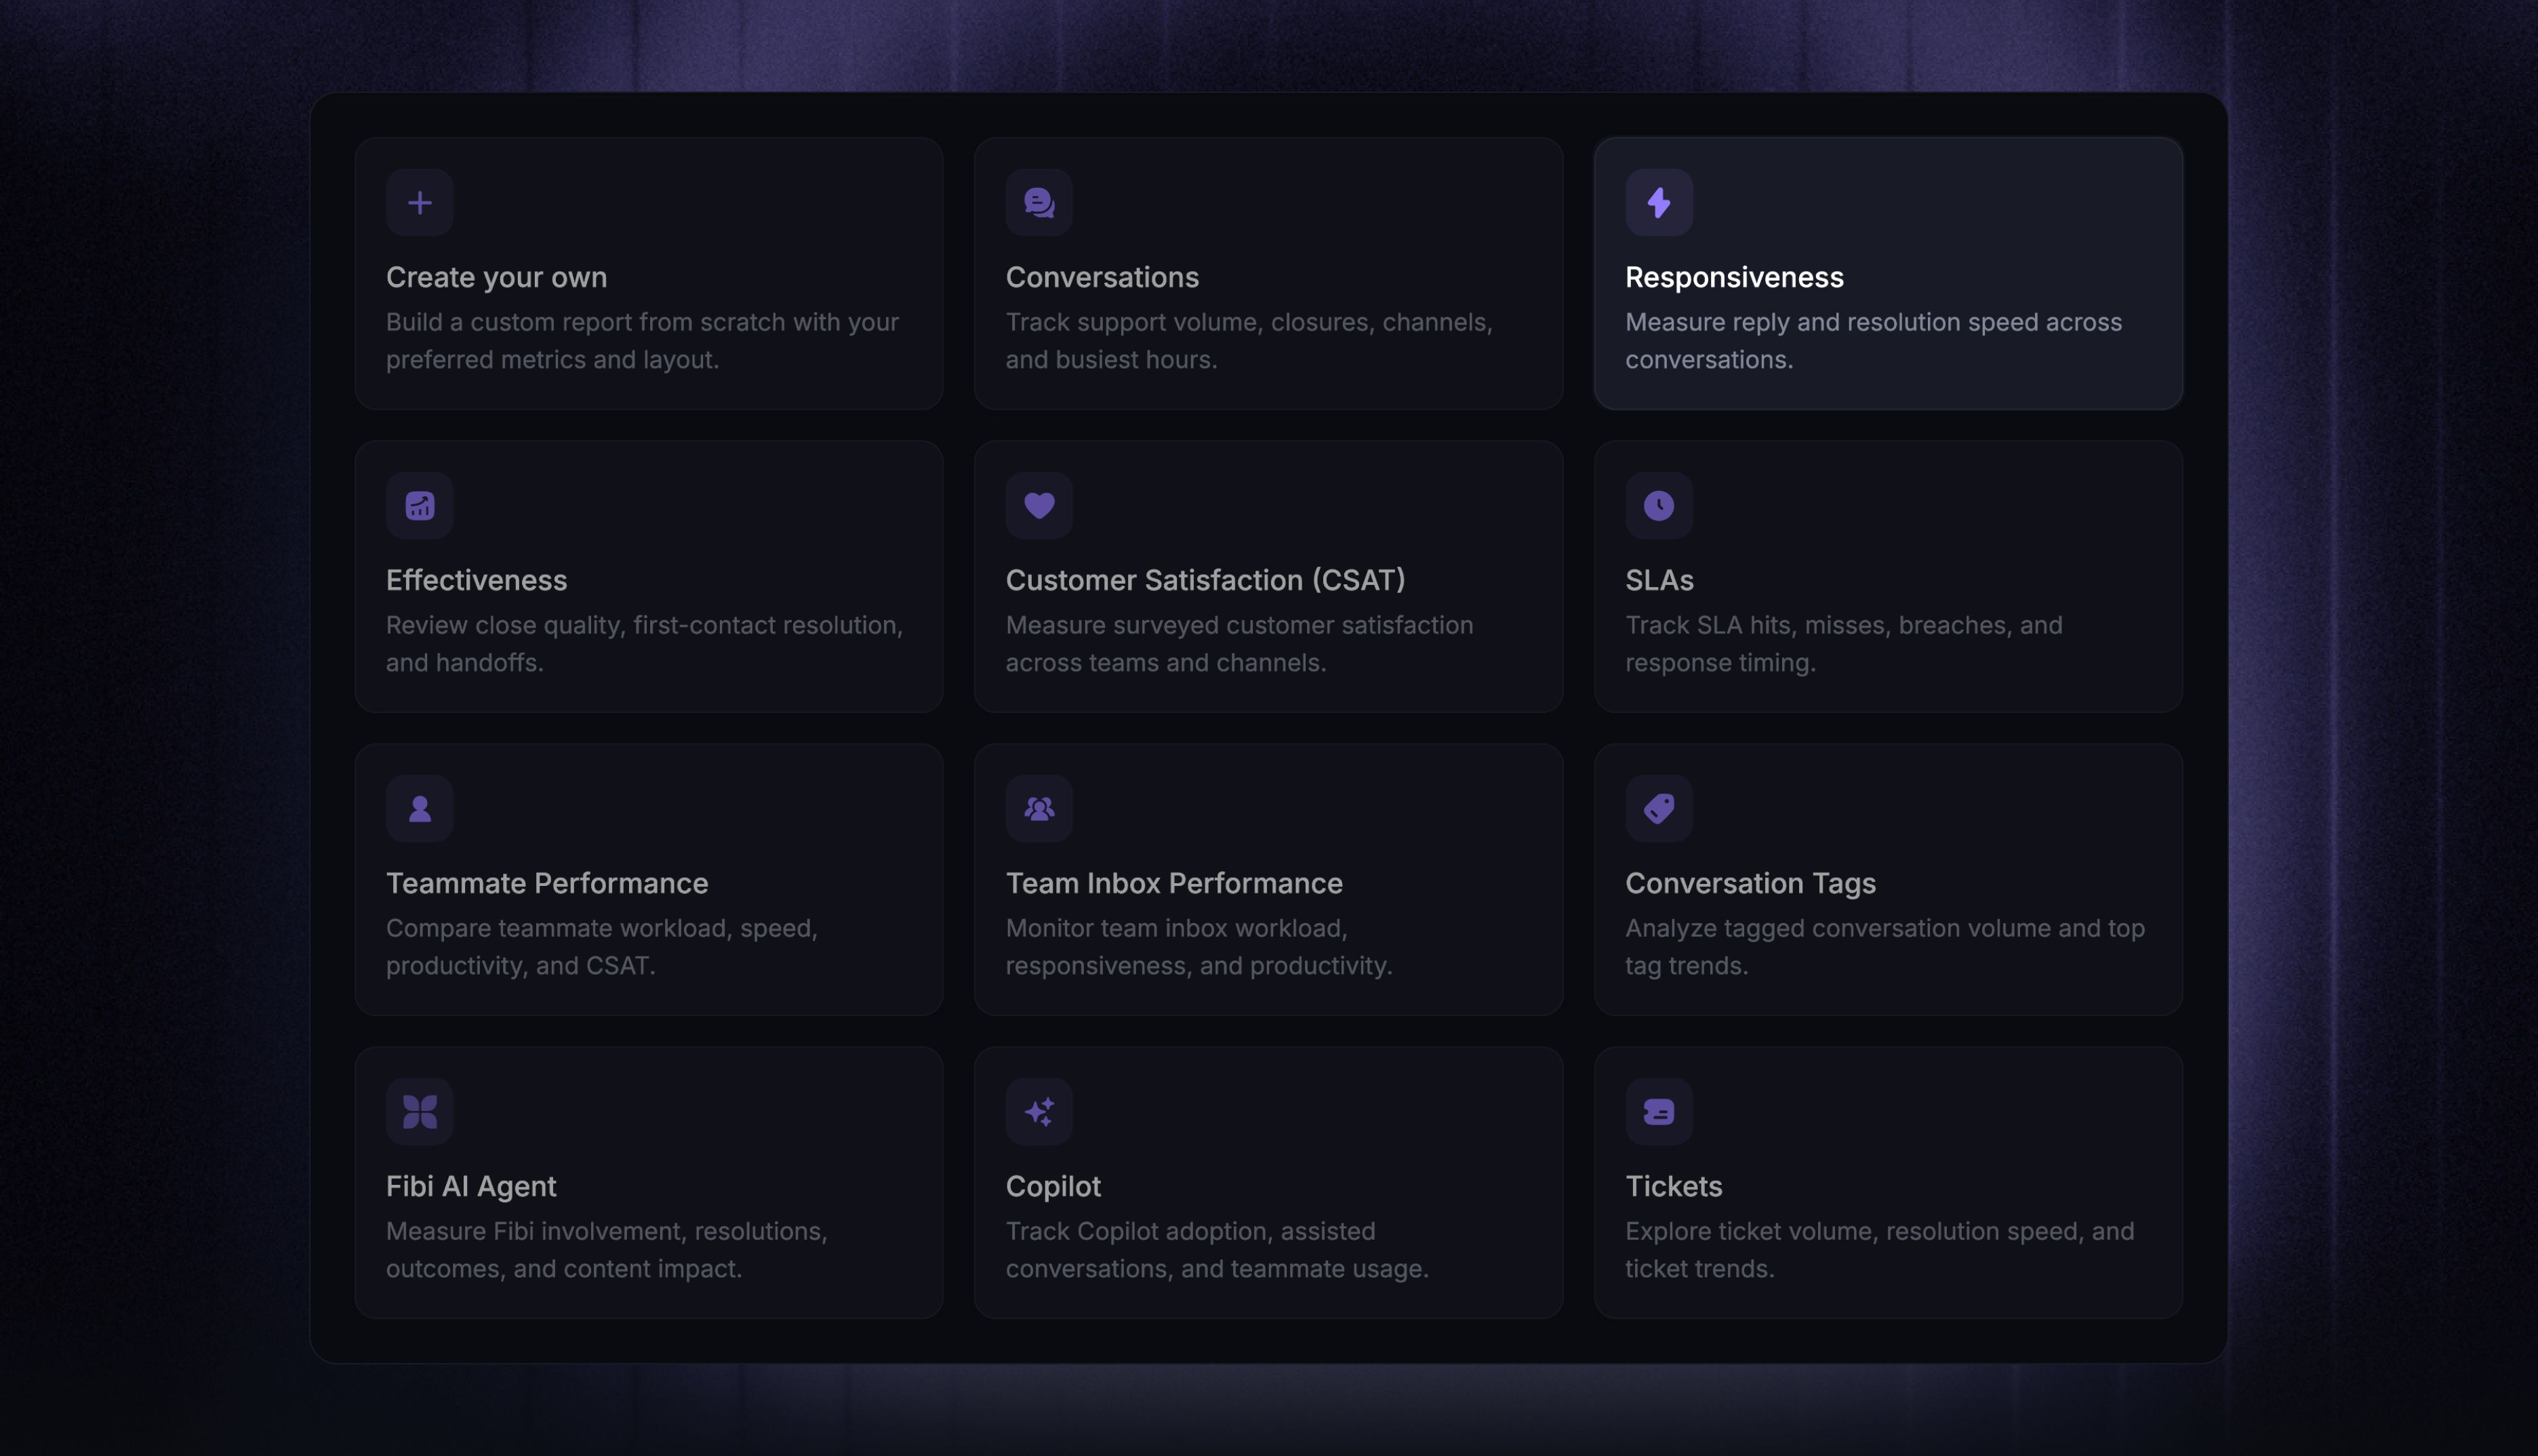
The ‘Responsiveness’ template measures reply and resolution speed across your conversations: how long customers wait for a first reply, for every reply after that, and for their conversation to be closed.
Go to the Reports tab and create a new report. Select the ‘Responsiveness’ template to get started quickly.
Notes:
Every chart in this template uses ‘All hours’ by default, so nights and weekends count. Turn on "Within office hours" for supported metrics to exclude time outside your workspace schedule.
You can also combine reporting metrics and attributes to create your own custom report.
Response and resolution speed
Headline metrics
Three KPIs summarize the selected period:
‘Median response time: including time assigned to bot’
‘Median first response time: including time assigned to bot’
‘Median time to close: including time assigned to bot’
In these chart labels, bot means the dedicated Bot inbox, not Fibi AI Agent or Workflows as an actor. The Reporting metrics and attributes reference explains the exact definitions and available variants.
Note: First-response and time-to-close charts group conversations by when they started, while response-time charts group each customer wait by when it began. A reply or close can happen after the selected period, so a duration can be longer than the report's date range.
Response time
‘Median response time: including time assigned to bot - by time’ tracks the headline metric across the date range, so a slow week stands out instead of disappearing into a period-wide median.
First response time
Two charts cover first-response speed:
‘Median first response time: including time assigned to bot - by time’ - tracks first-reply speed over time
‘First response time: including time assigned to bot breakdown’ - groups the same conversations into preset wait-time ranges
Conversations without a visible teammate reply do not contribute to either chart.
Time to close
Two charts cover resolution speed:
‘Median time to close: including time assigned to bot - by time’ - tracks resolution speed over time
‘Time to close: including time assigned to bot breakdown’ - groups conversations into preset duration ranges
Both charts only count conversations closed at least once by a teammate.
Hourly distribution of response times
‘Median hourly distribution of response times: including time assigned to bot’ is a heatmap of median response time by day of the week and hour.
Customize this report
Templates are read-only starting points. Click Use this template to create a custom report seeded with these charts. You can rename, remove, or reconfigure any chart, while the built-in template stays unchanged. New reports are private until you share them.
Useful filters
Channel or Conversation tag - compare reply and resolution speed across different sources or conversation types
Teammate or Team - compare the people or teams responsible for each reply or close; these dynamic filters follow the metric being charted
You can also change the date range and add prebuilt Responsiveness charts, including the variants that exclude time in the Bot inbox.
Learn more about customizing reports →
Responsiveness report use cases
Respond quickly to every message
‘Median response time: including time assigned to bot - by time’ shows how long customers wait for a teammate reply at any point in a conversation, not only after the first message.
Prioritize new conversations
‘Median first response time: including time assigned to bot - by time’ shows how long customers wait for the first visible teammate reply.
‘First response time: including time assigned to bot breakdown’ shows the share of conversations in each wait-time range, helping you decide when new conversations need more coverage.
Resolve issues faster
‘Median time to close: including time assigned to bot - by time’ shows how quickly teammates close conversations, while ‘Time to close: including time assigned to bot breakdown’ shows how many fall into each duration range.
Be more responsive
‘Median hourly distribution of response times: including time assigned to bot’ highlights the days and hours when replies are slowest. It includes both first and later response times, helping you spot gaps in team coverage.
FAQs
Which first response time variant should I use?
Which first response time variant should I use?
Choose the variant based on when you want the timer to start:
First response time (started, including bot) - measures the full wait from conversation start to the first visible teammate reply, including time in the Bot inbox
Excluding bot - starts when the conversation permanently leaves the Bot inbox for teammate handling
If the conversation never entered the Bot inbox, both variants start at conversation start.
Why do two first response time charts show different numbers?
Why do two first response time charts show different numbers?
They likely use different chart settings:
Bot time - included or excluded
Timestamp - conversation start or first reply time
Office hours - on or off for each chart
Hover the info icon next to each chart title to compare its metric description, Timestamp, Aggregation, and office-hours state. See Troubleshooting custom reports for other causes of mismatched numbers.
Was this helpful?
Still need help? Ask the team