Explore report data with drill-in
Open drill-in on any report chart to see the rows behind the number - filter, sort, choose columns, preview conversations, and export to CSV.
Written By Markus Palm
Last updated 16 days ago
Overview
When a report number needs a closer look, use drill-in to see exactly what is behind it. Drill-in opens the matching conversations, replies, ratings, or tickets in a table where you can inspect individual records and export them to CSV. It works on every chart, in built-in templates and custom reports alike.
Common use cases:
Inspect a spike - open the exact conversations behind an unusual day before reporting it to your team
Review a teammate's numbers - see the replies or closes behind one bar in a performance chart
Verify a metric - check what a number actually counts before you share the report
Pull a working list - export the conversations behind a number to CSV
Note: Drill-in and CSV export use separate workspace permissions. Can access Chart drill-in is required to open the rows, while Can export CSV is also required to download them. Workspace admins manage both under Settings → Members and teams.
How drill-in works
Open drill-in
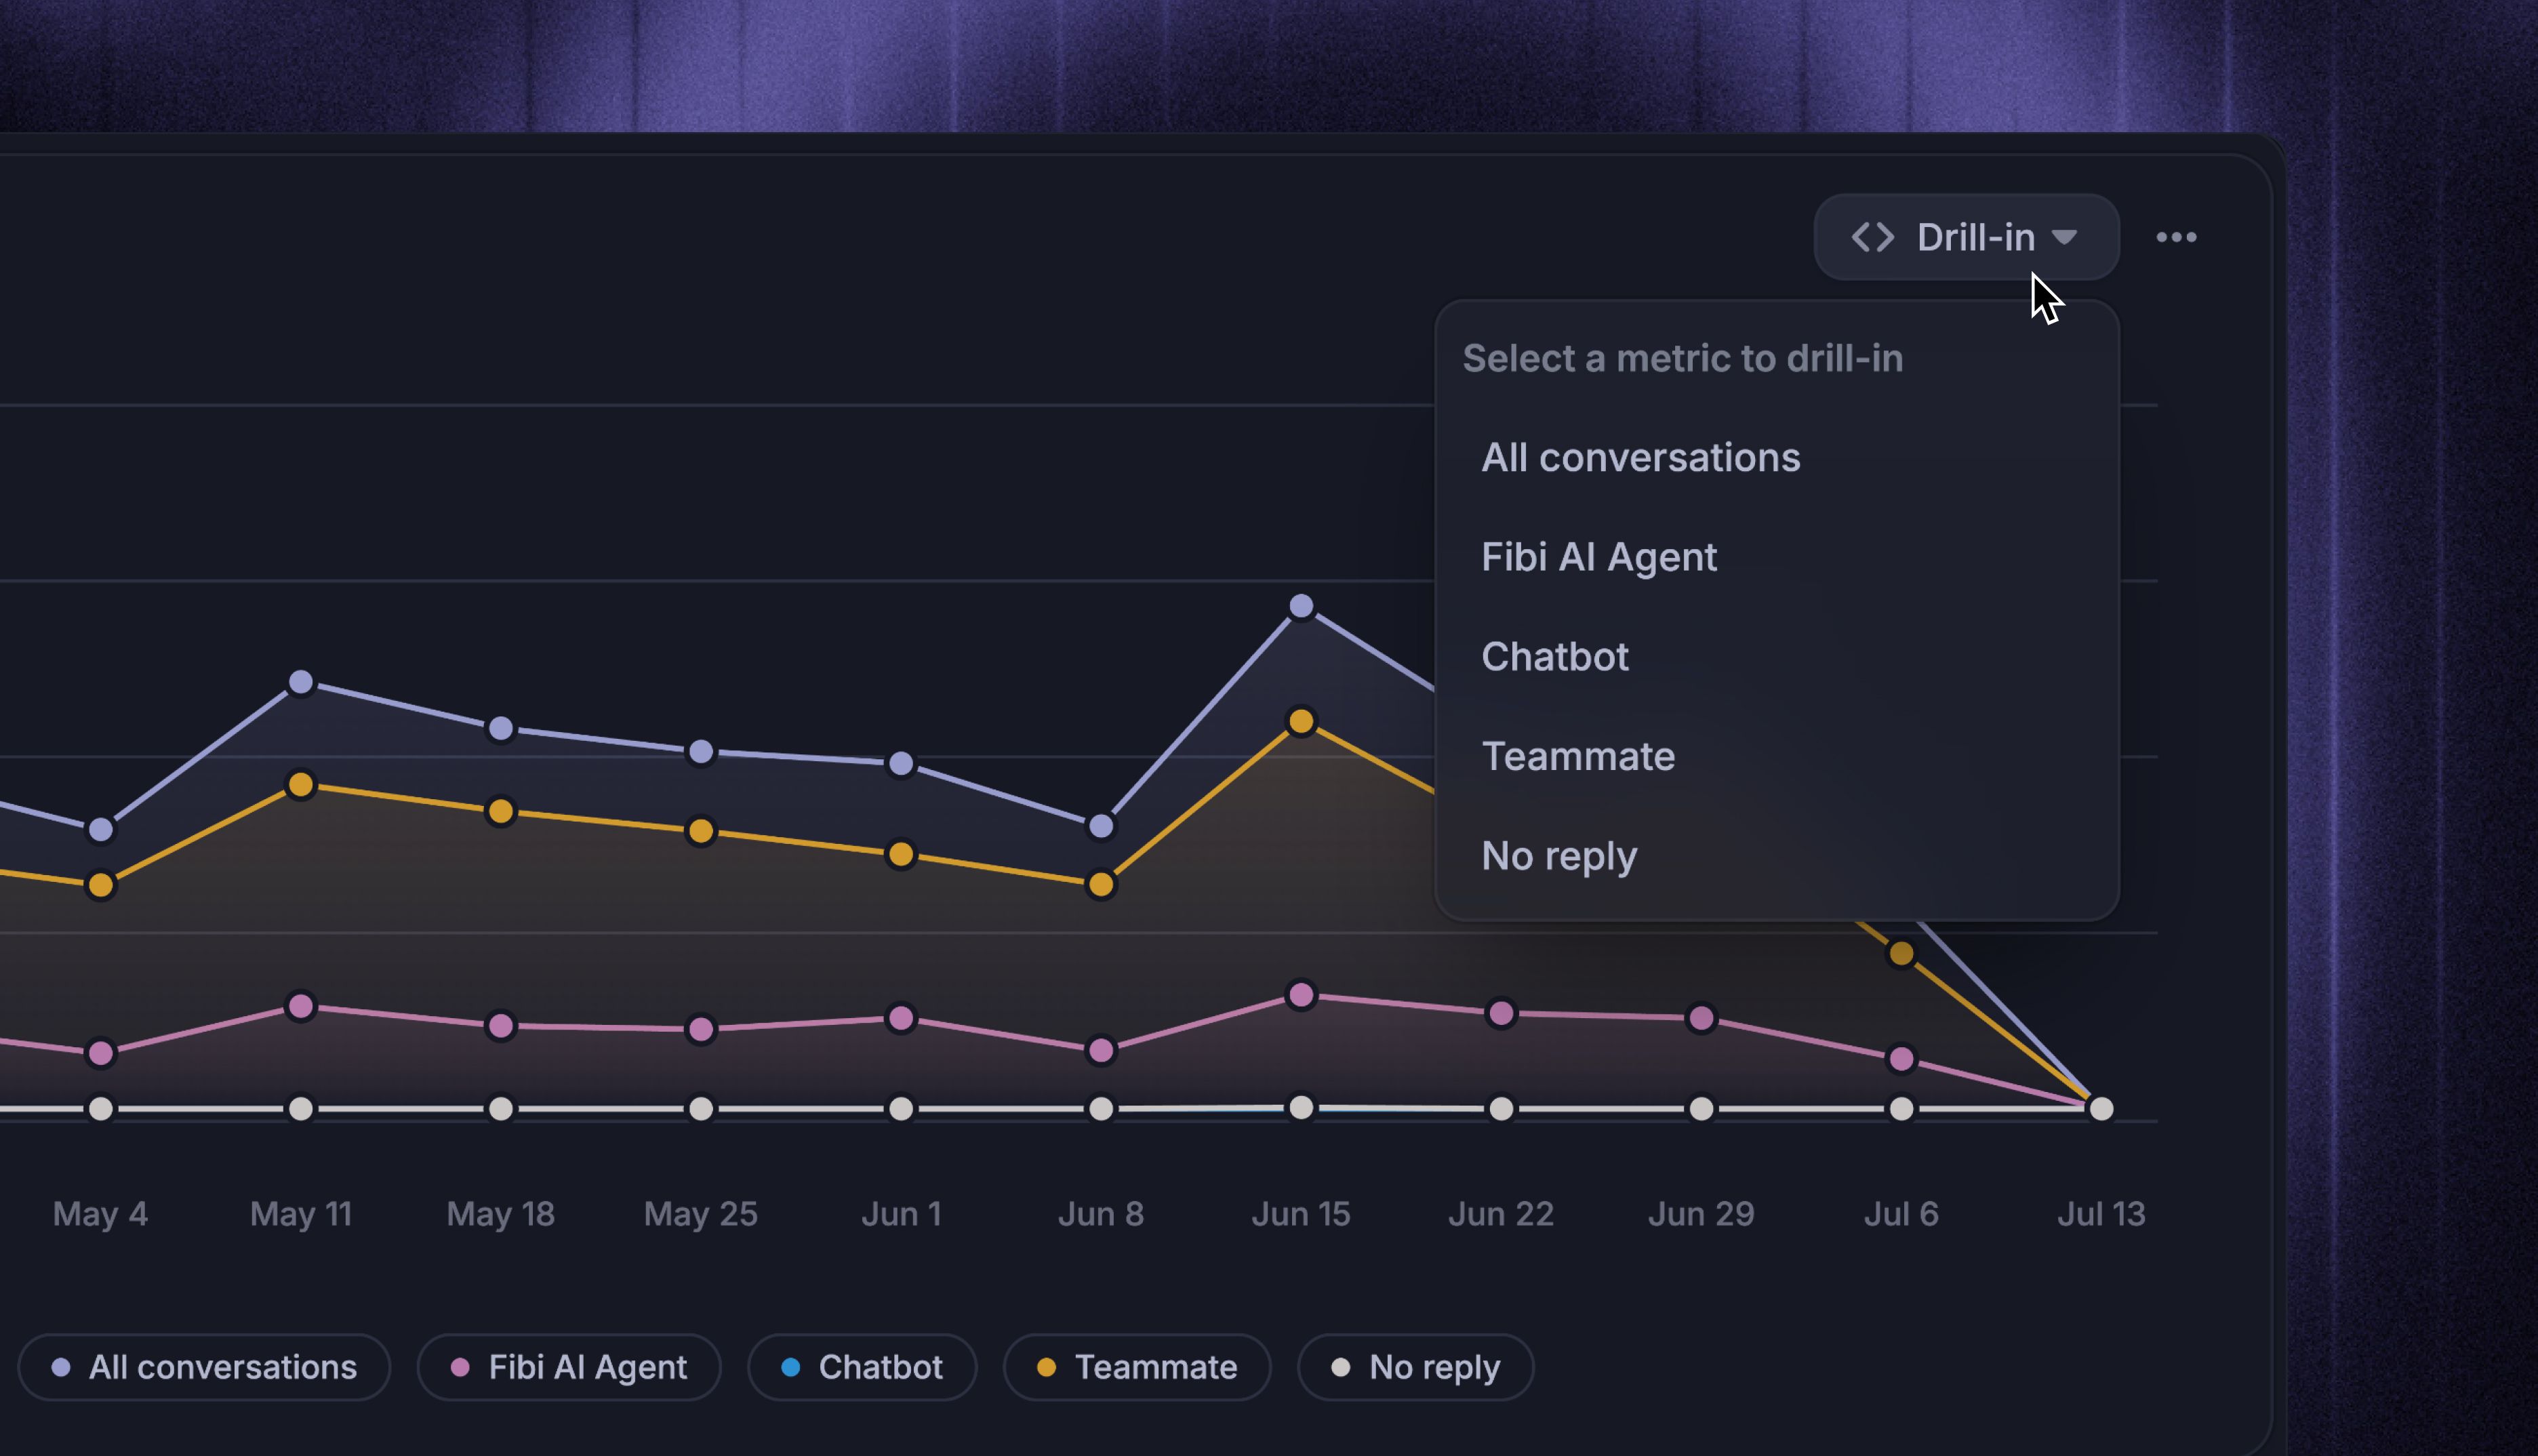
Hover a chart and click ‘Drill-in’. If the chart plots several metrics, pick the one to drill into from the list. Drill-in is also available as ‘Chart drill-in’ in the chart's actions menu, under ‘Data exploration’.
On column, bar, line, area, combo, and table charts, you can also click a bar, point, or row directly. Drill-in then opens scoped to that data point (e.g. clicking one week's bar in a chart segmented by channel shows only that week and channel's rows).
Either way, the drill-in opens with the chart's exact scope: its date range, the report-level and chart-level filters, and the data point you clicked.
Work with the rows
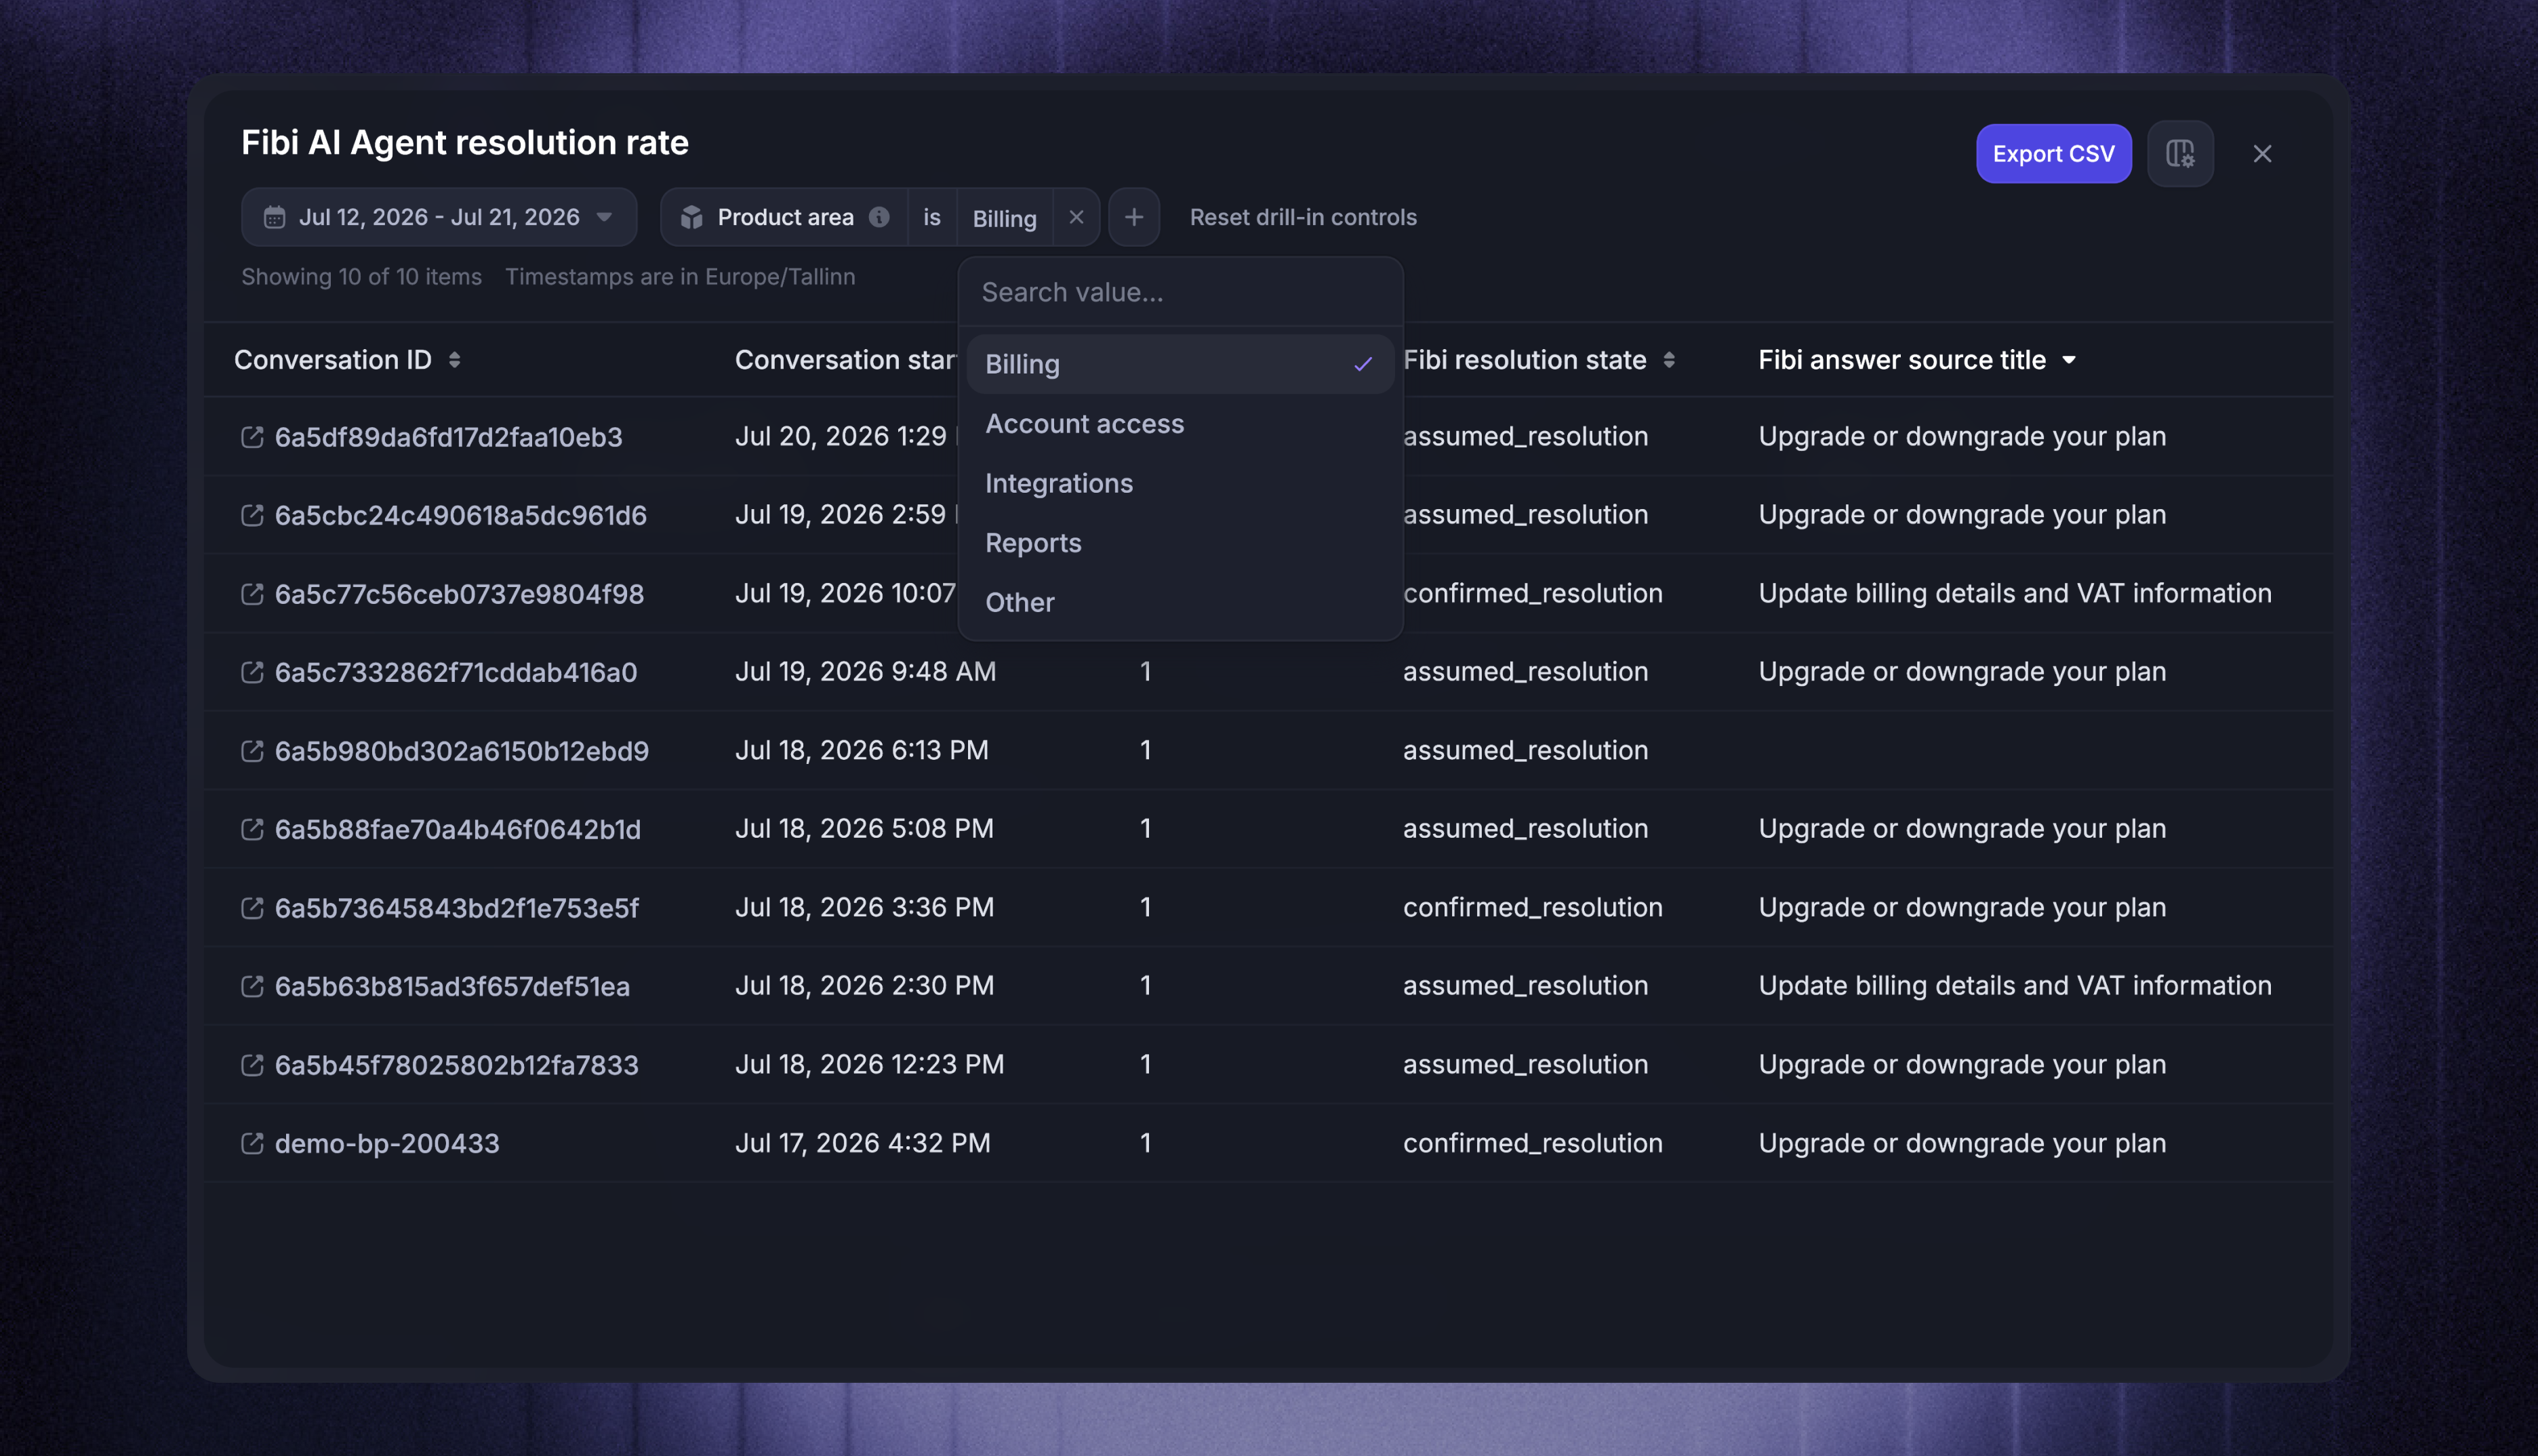
The table shows one row per record in the dataset behind the metric - a conversation, a reply, a rating, a ticket. The header shows how many rows match, and more rows load as you scroll.
Filter - use the filter bar to narrow the rows, the same way you filter a report. It only offers attributes the selected metric supports
Sort - click a column header to sort ascending or descending
Change the date range - pick a different range to widen or narrow the window
Changes you make inside the drill-in are temporary - they never modify the chart or the saved report. Click Reset drill-in controls to return to the chart's original scope.
Choose columns
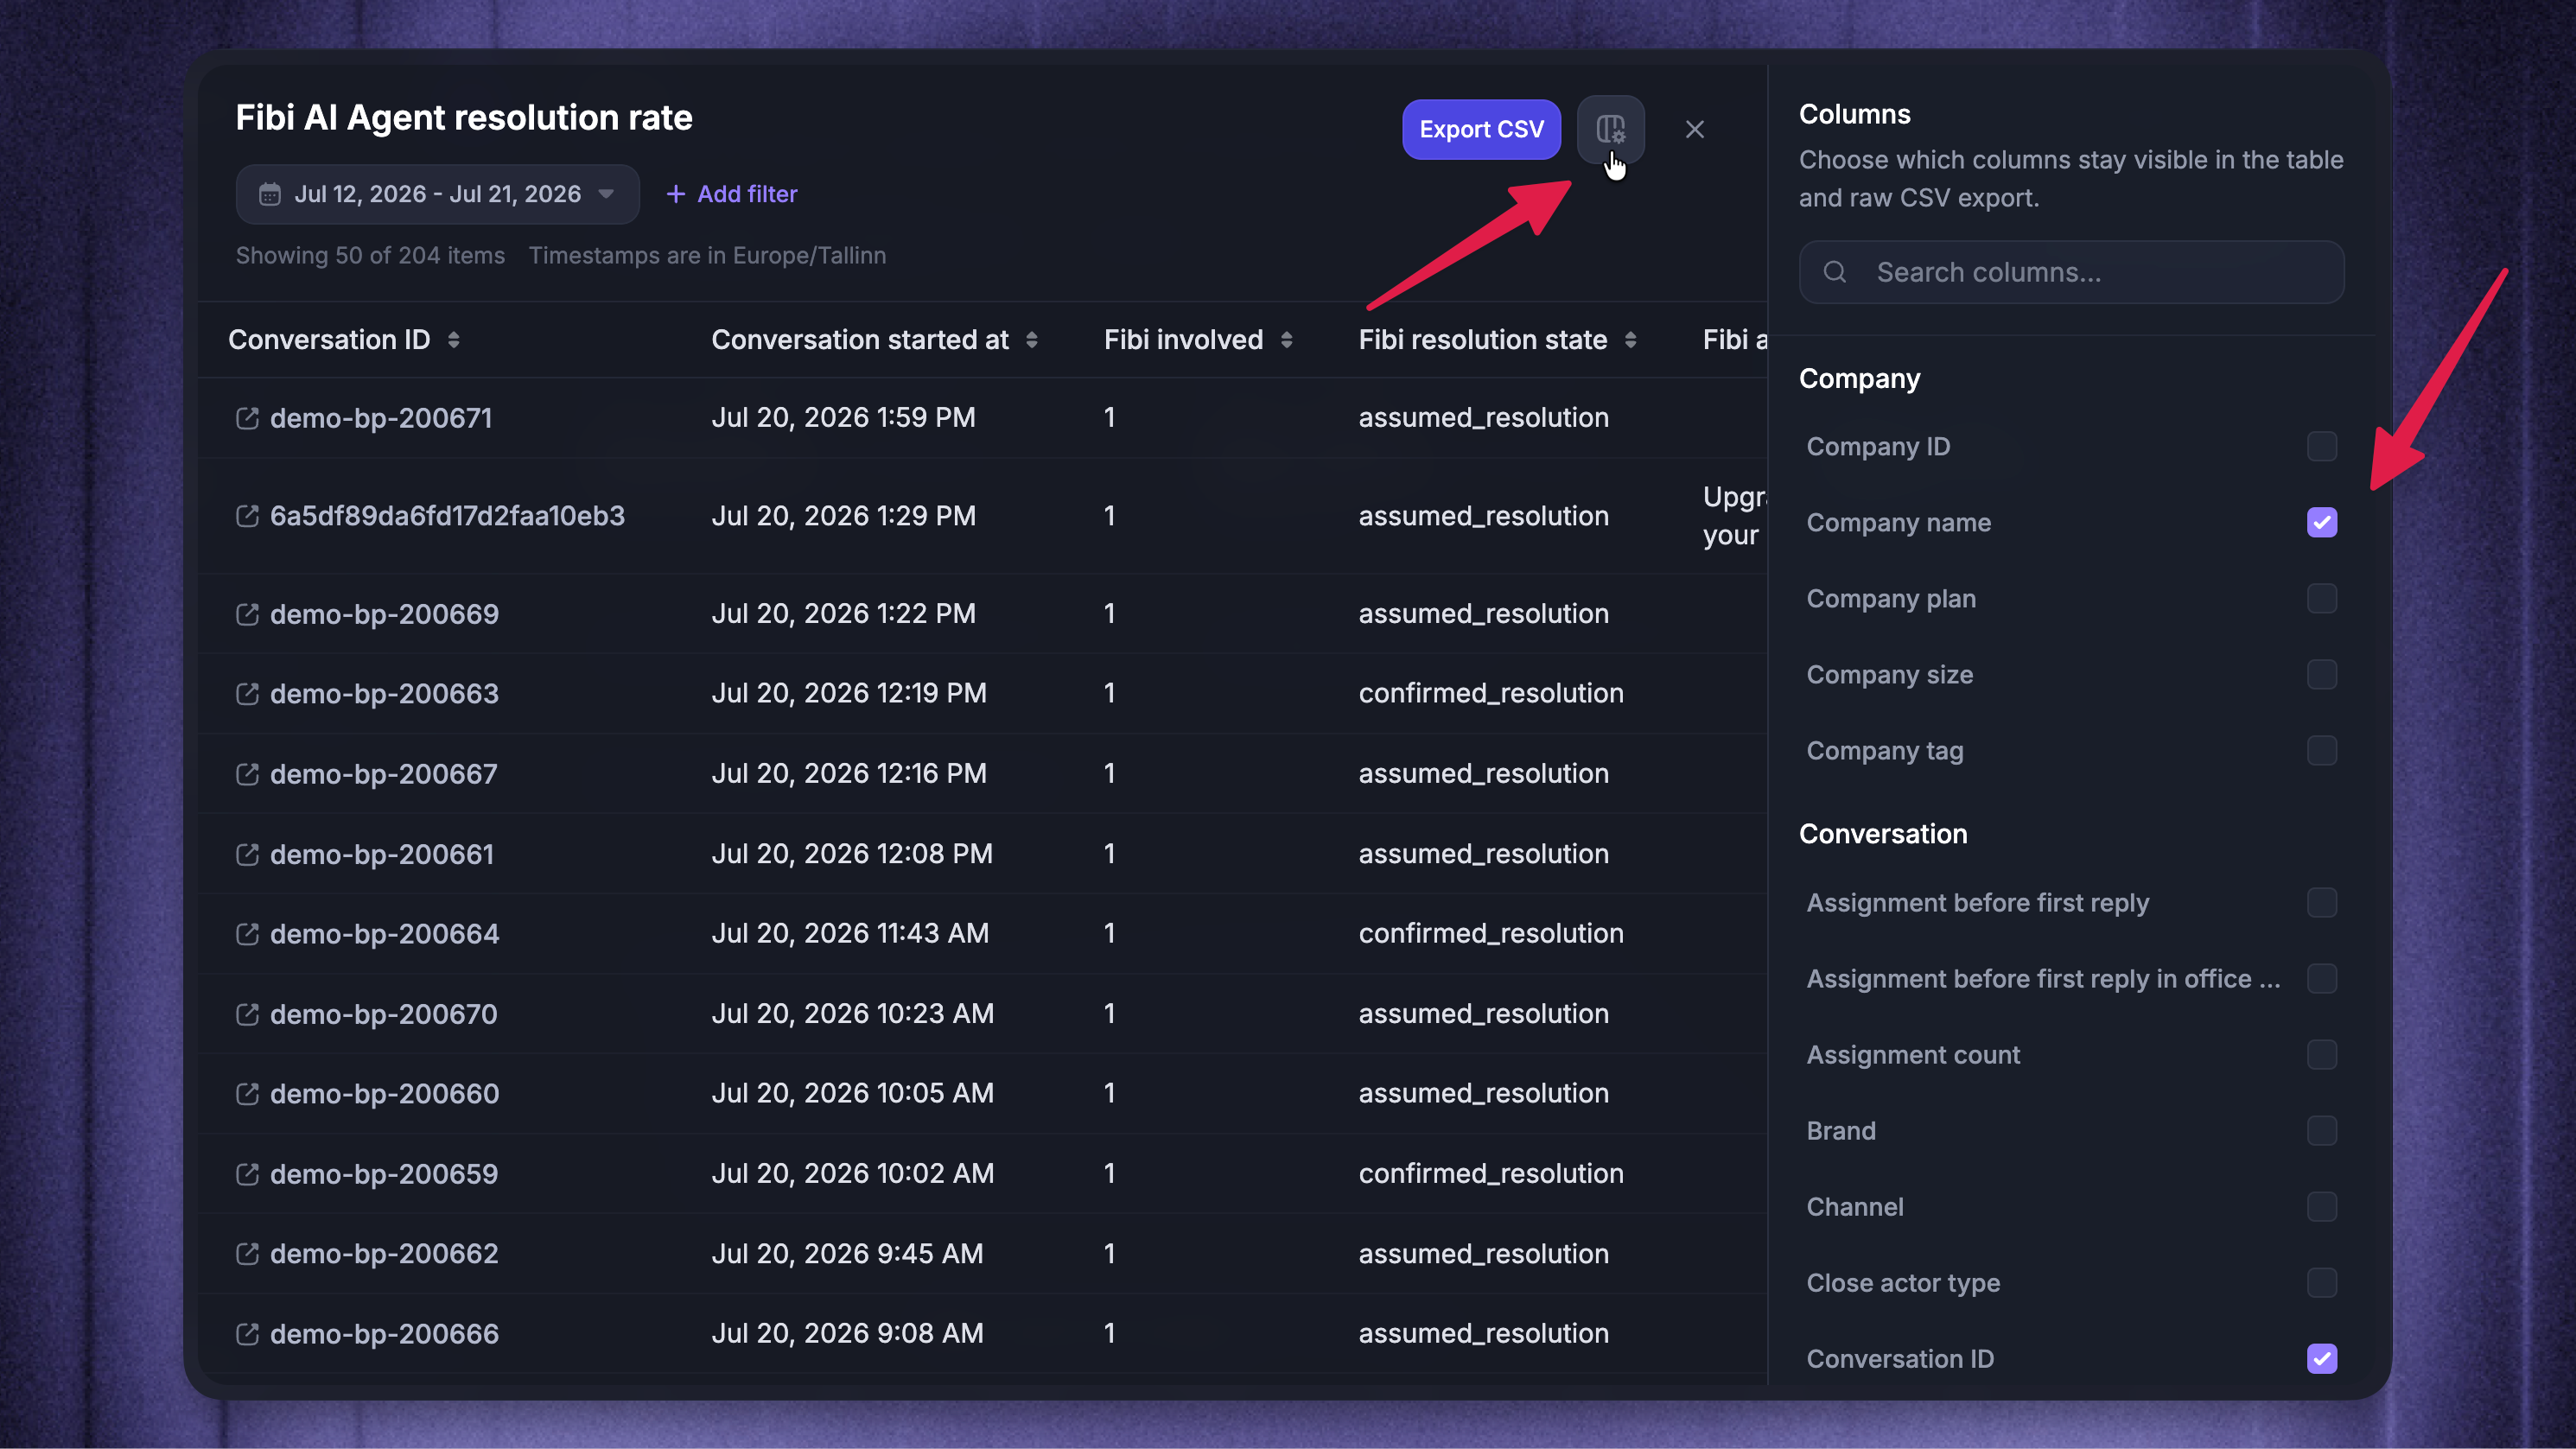
Click the columns button in the top-right to open the Columns panel.
Search or browse the available columns, grouped by category, and toggle the ones you want - the visible columns are also what the CSV export includes. At least one column must stay visible.
Default columns depend on the metric and dataset. They include the most useful identifiers and timestamps for those rows, plus the chart's View by and Segment by attributes when applicable. Metric-specific columns, such as a response duration or rating, are included where useful. Your changes are saved per chart, so the table looks the same the next time you drill in.
Tip: Use the Reporting metrics and attributes reference to check what each available filter and column means and which datasets support it.
Preview a conversation
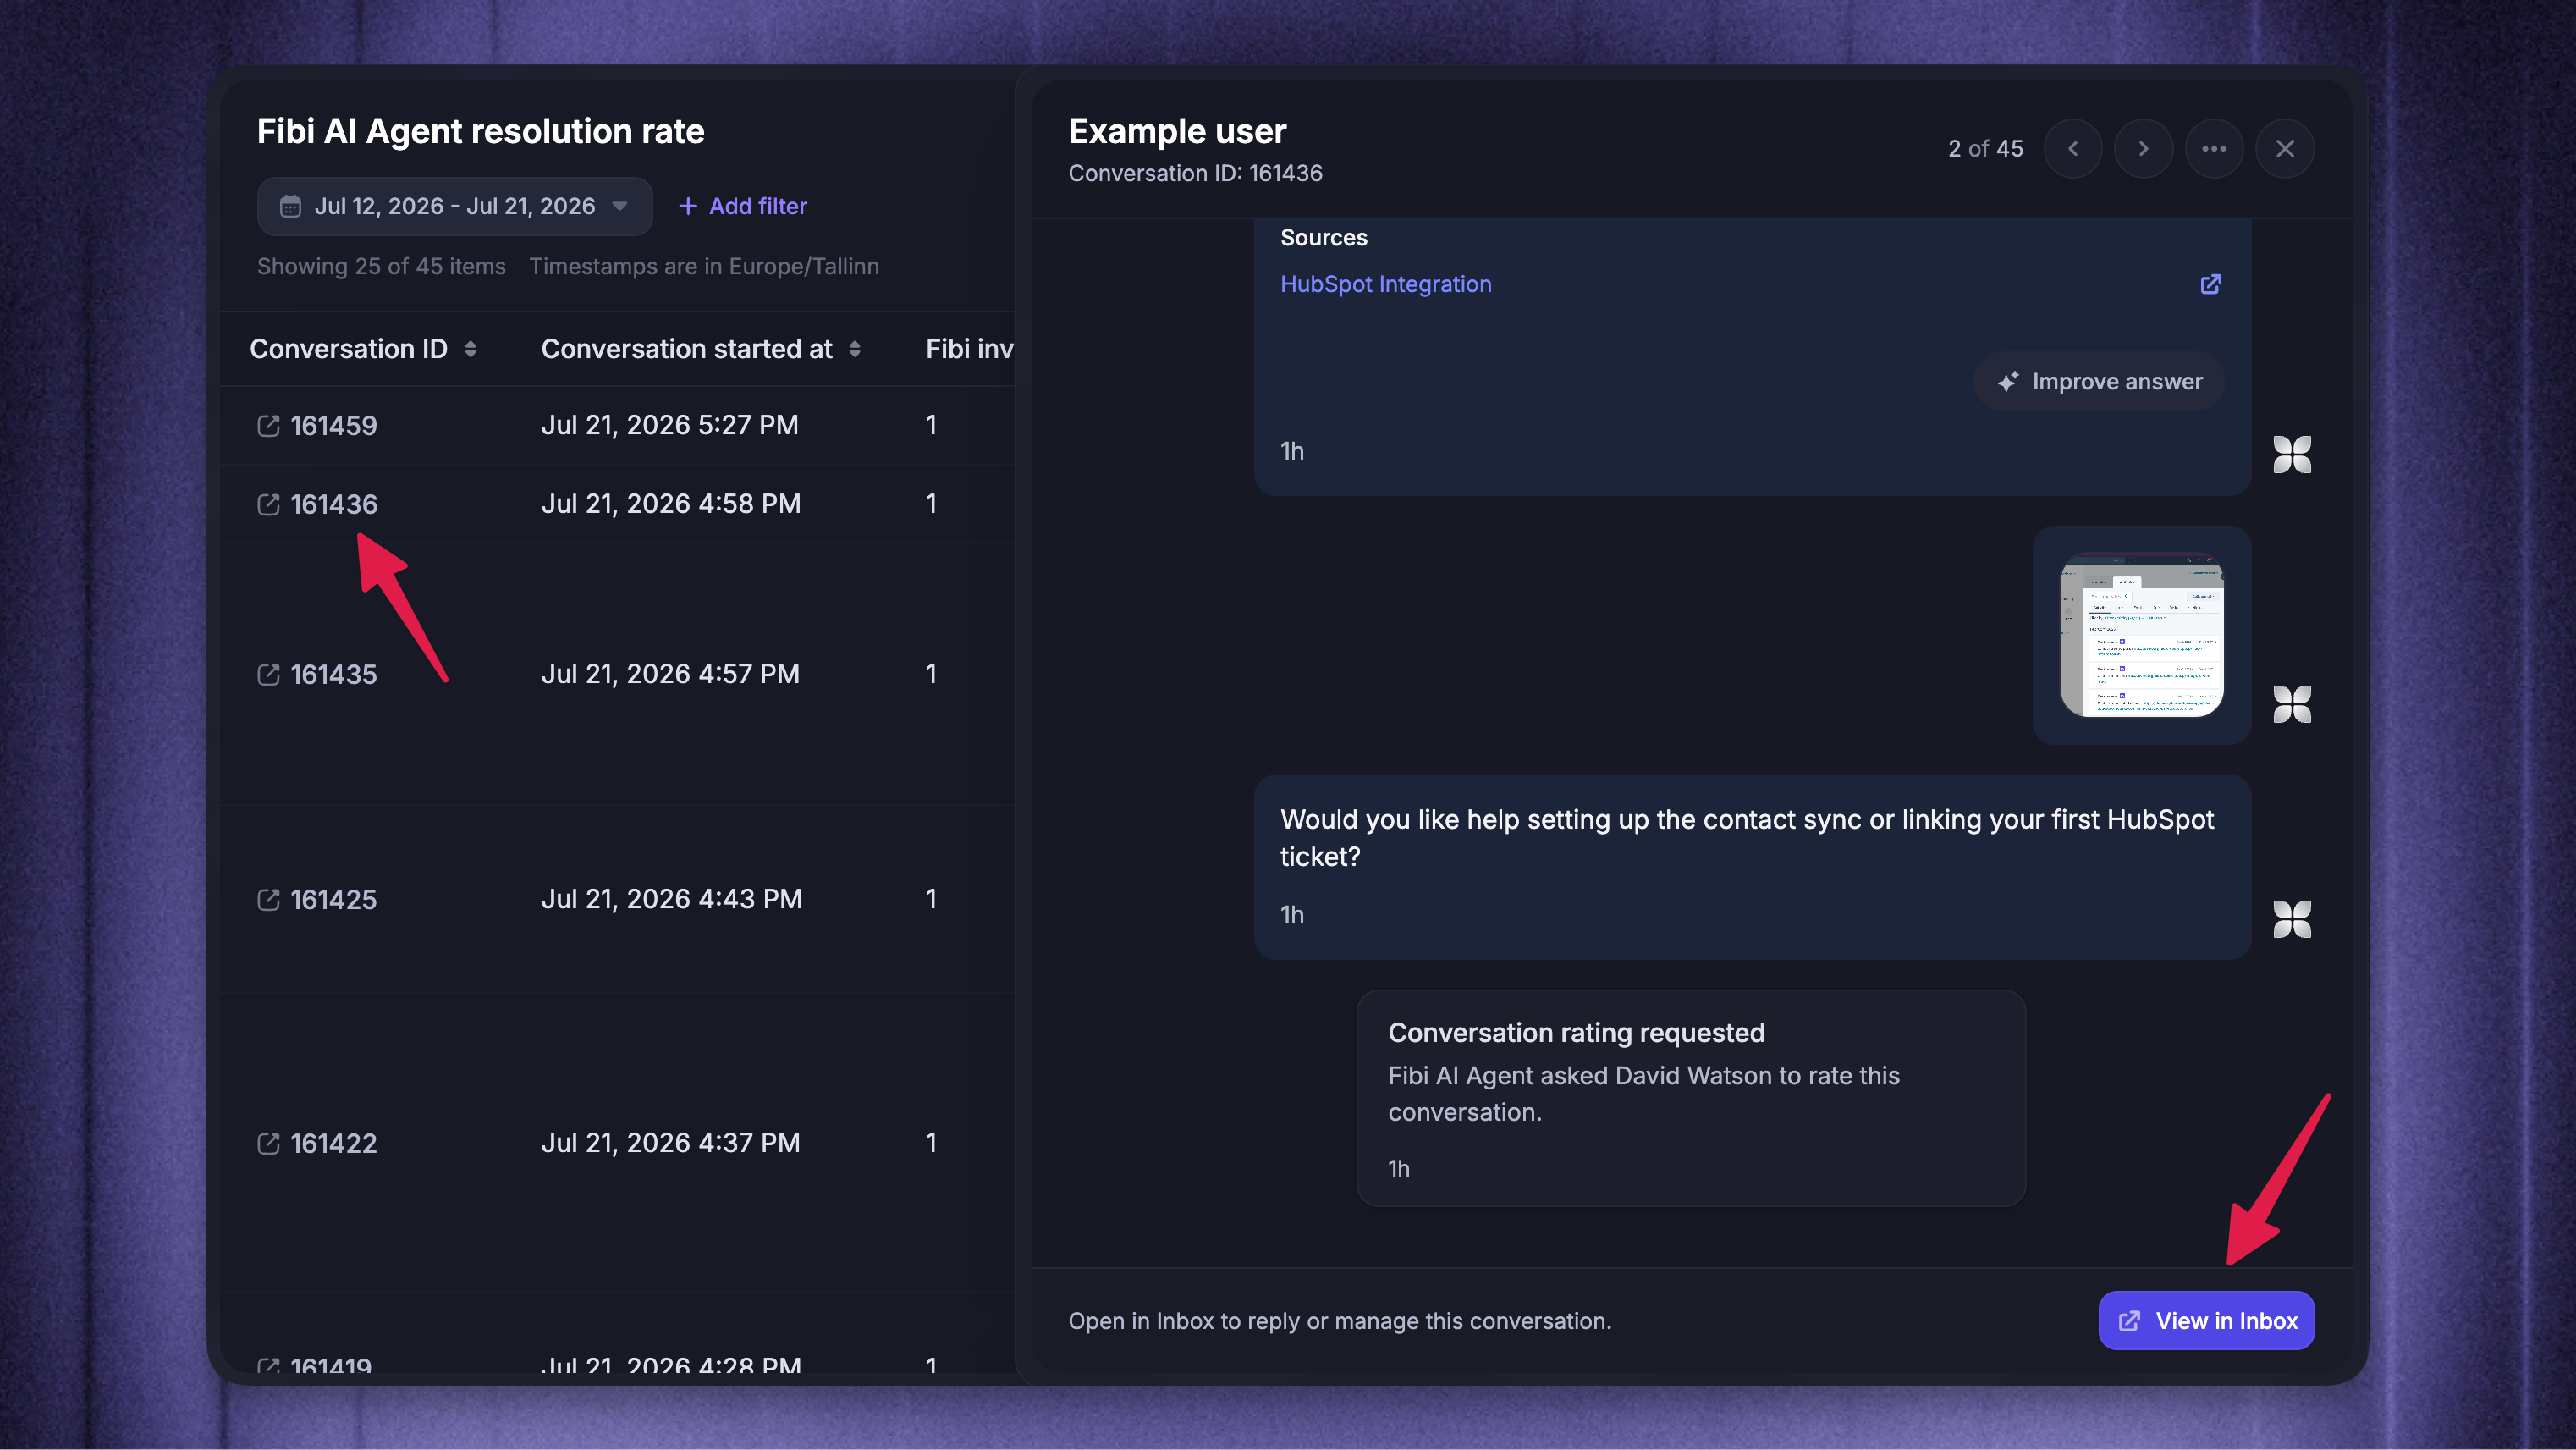
Click a conversation ID in the table to preview the full conversation in a panel without leaving the drill-in.
On per-event rows like replies, click the Action ID to open the preview highlighting the specific message the row represents. To open the conversation in the Inbox in a new tab instead, click the Open in Inbox icon next to the ID.
Export the rows
Click Export CSV to download the matching rows with exactly the columns you have visible:
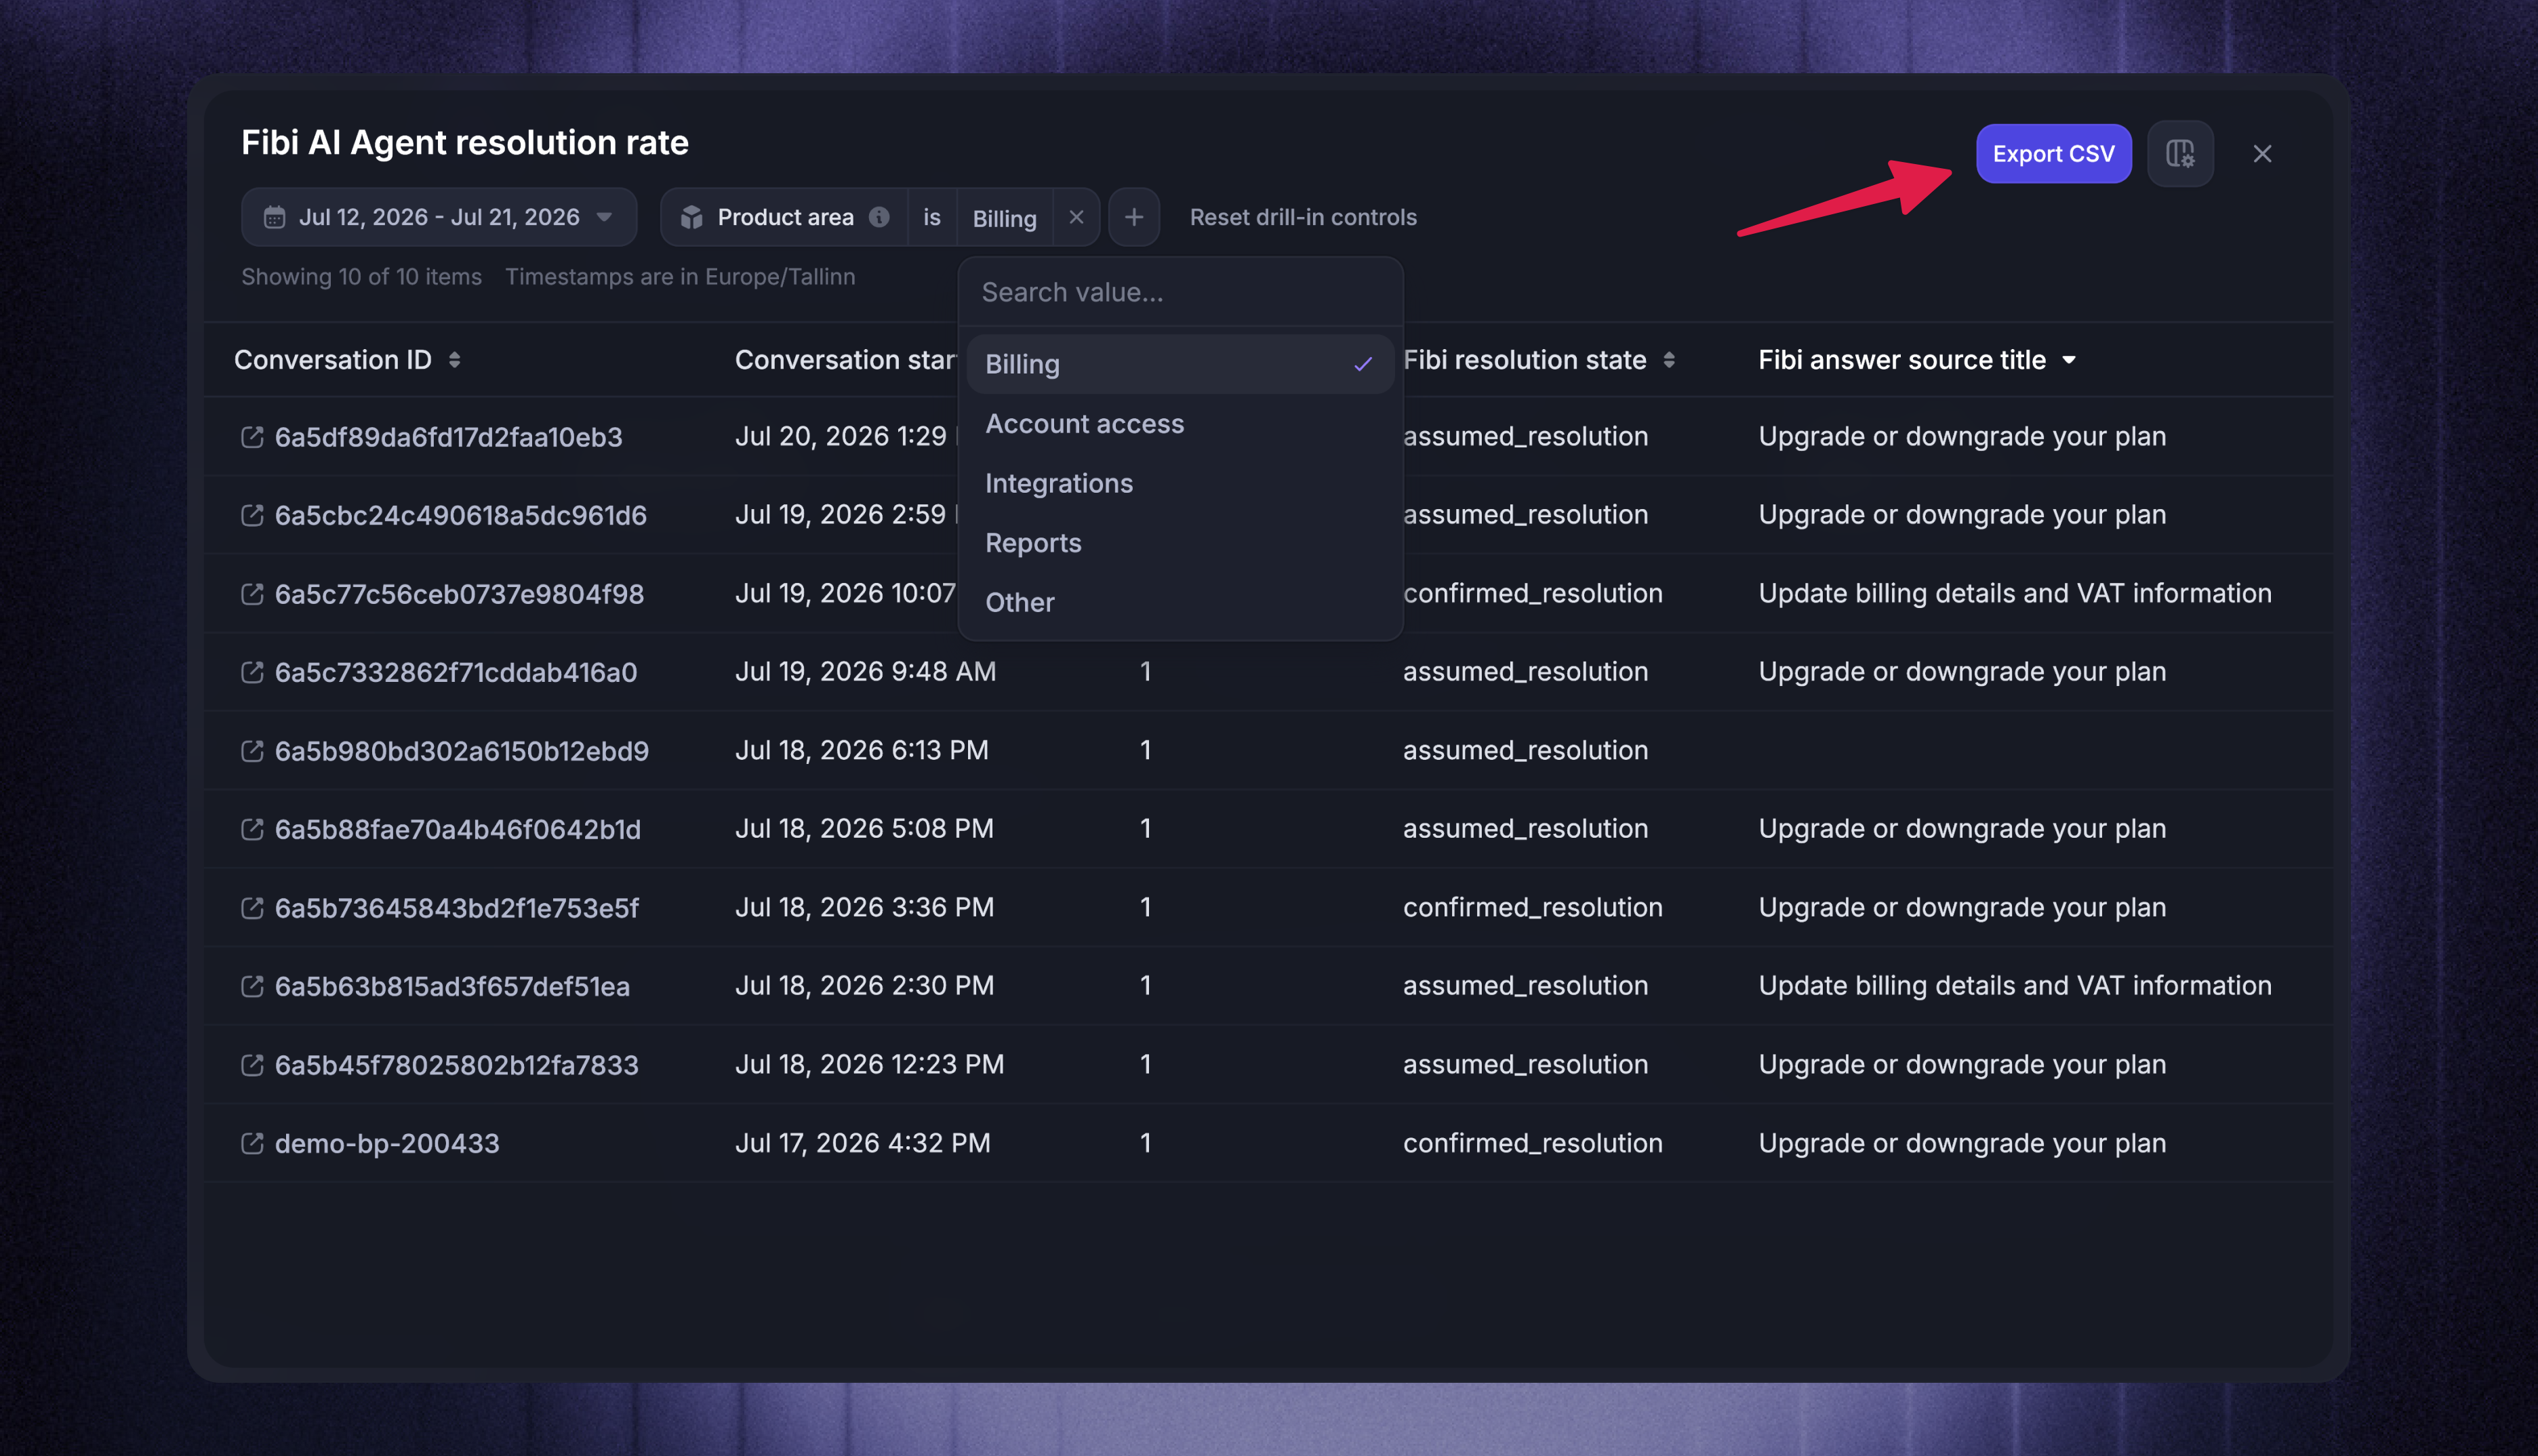
Note: Drill-in CSV exports include up to 10,000 rows. If the drill-in contains more, the export fails. Narrow the filters or date range, or use a dataset export for up to 100,000 rows.
FAQs
Who can use drill-in?
Who can use drill-in?
Teammates with the Can access Chart drill-in permission. On a report a teammate shared with you, you also need Explore only or Full access - View only viewers can read the report but not open drill-in.
What timezone is used for dates in drill-in CSV exports?
What timezone is used for dates in drill-in CSV exports?
The timezone shown above the drill-in table is used. It also appears in every date column header in the CSV.
Why are dates formatted differently in the CSV export?
Why are dates formatted differently in the CSV export?
The CSV uses YYYY-MM-DD HH:mm:ss so spreadsheet apps can parse and sort dates consistently. The drill-in table uses a more readable display format.
Why can drill-in show more rows than the chart value?
Why can drill-in show more rows than the chart value?
Some metrics count unique conversations even though drill-in shows the individual event rows behind them. Conversations replied to, for example, counts each conversation once in the chart, while its drill-in can show multiple replies from that conversation.
For event-based metrics like Replies sent or Response time, each event is its own row. This is why the same conversation can appear several times and why the drill-in row total does not always match the chart value.
Why can drill-in show fewer rows than the chart value?
Why can drill-in show fewer rows than the chart value?
Conversation-based charts can include conversations that you do not have permission to open in the Inbox. Drill-in respects your Inbox conversation access, so it can show fewer rows than the chart total, or none.
Ask a workspace admin to confirm that you can access the relevant conversations - changing the drill-in filters will not reveal conversations you cannot open.
Can people viewing an external share link drill in?
Can people viewing an external share link drill in?
Was this helpful?
Still need help? Ask the team