Support analytics
See how helpful your content is, what can be improved, and the top-viewed articles.
Written By Markus from Featurebase
Last updated 2 months ago
Overview
Support metrics give you an overview of your support workload, allowing you to analyze trends, identify improvement areas, and understand if you’re working efficiently – both at the team and individual level.
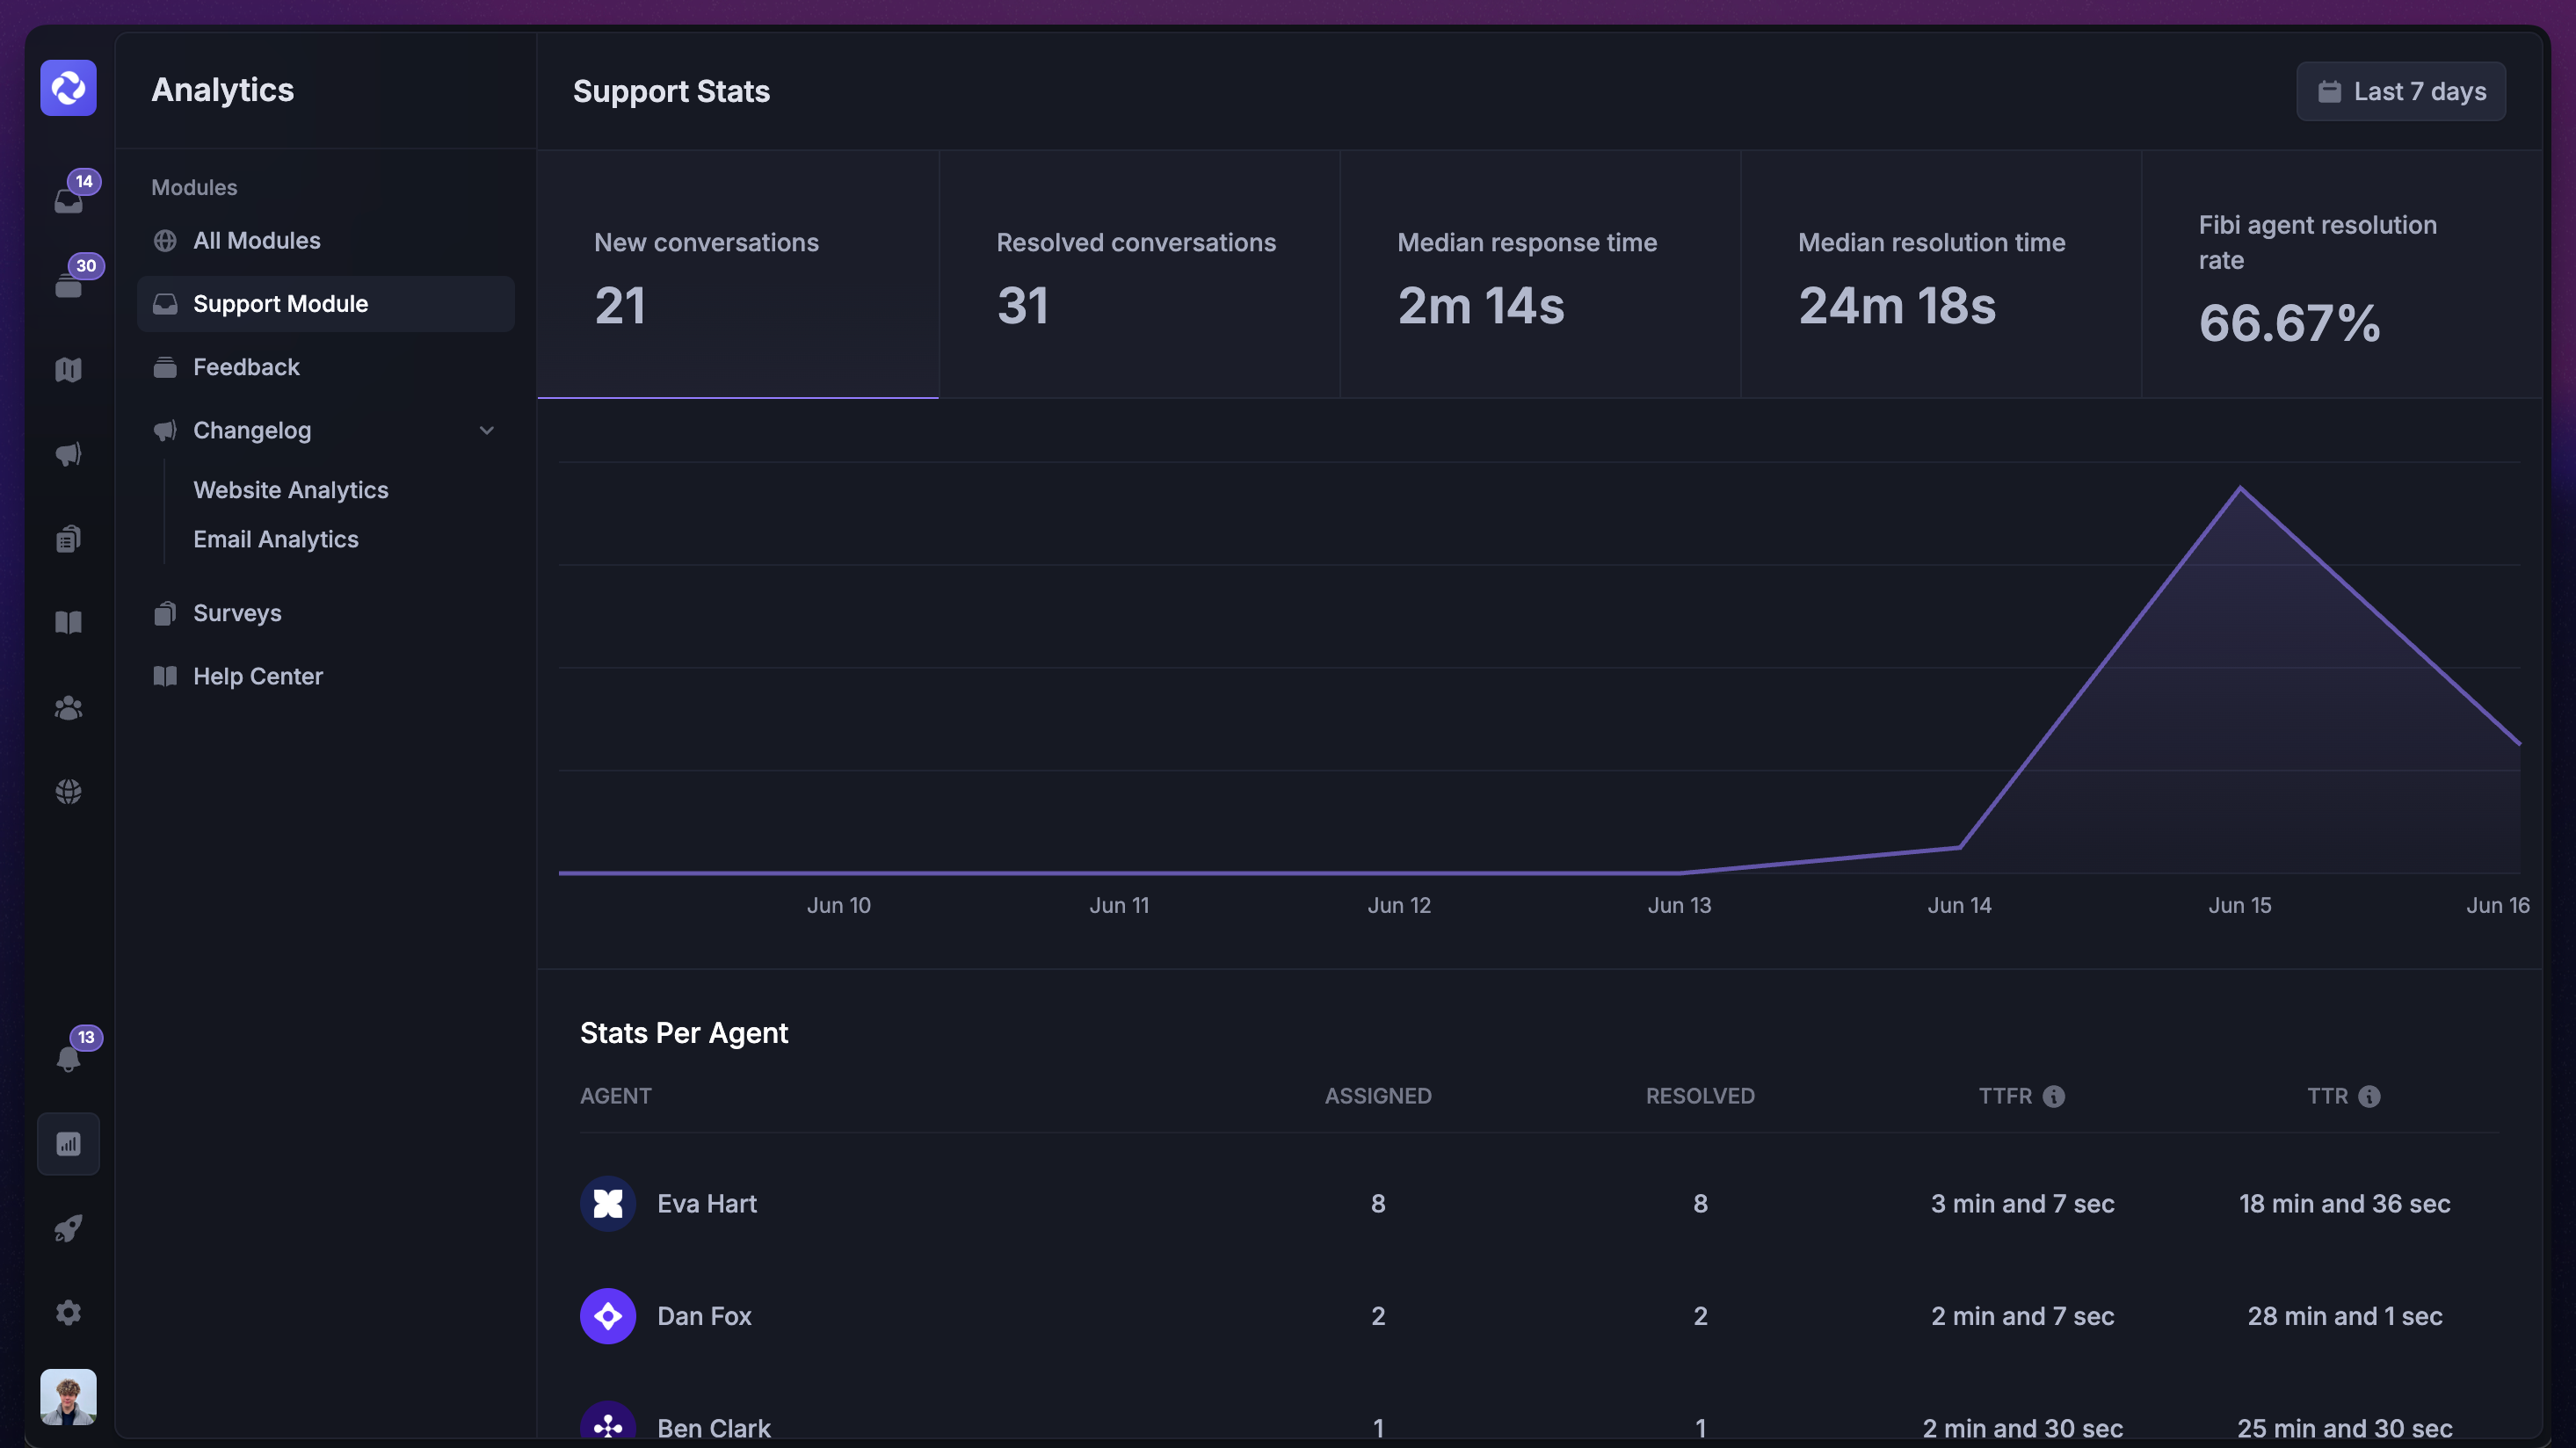
At the top of the dashboard, you'll see the most important stats at a glance:
New conversations – How many new customer conversations were started
Resolved conversations – How many have been fully handled and closed
Median response time (TTFR) – The median response time of your whole team
Median resolution time (TTR) – The median resolution time of your whole team
Fibi Agent resolution rate – % of conversations successfully solved by the AI agent
Further down, you’ll find metrics broken down by each individual teammate:
Conversations assigned – How many conversations they were responsible for
Conversations resolved – How many were closed out by them
Median time to first response (TTFR) – How long it typically took them to respond
Median time to resolution (TTR) – How long it typically took them to resolve an issue
This makes it easy to spot who's handling what, how quickly they’re resolving issues, and where things might be slowing down.
You can change the time period of the data from the top right corner.
Get started with support analytics from the Analytics tab →
Good to know
All timing metrics are calculated based on your business hours (if you’ve configured them)
E.g. If a conversation comes in at 4 AM but your office hours start at 9 AM, and it’s answered at 9:30 AM – the response time is just 30 minutes, not 5.5 hours.
A conversation counts as resolved when it has been closed from your inbox